
Recruiting is becoming increasingly data-driven rather than intuition-driven. Hiring teams today are expected to justify their performance using measurable outcomes, not just hiring activity.
Yet many teams still track too many disconnected metrics without understanding which ones truly impact hiring success.
This guide breaks down 15 recruiting KPIs every hiring team should track, including:
- Hiring efficiency KPIs like time to fill and time to hire.
- Sourcing effectiveness metrics such as source of hire and outreach response rate.
- Hiring quality indicators like quality of hire, offer acceptance rate, and retention.
- Pipeline and candidate experience metrics that reveal where candidates drop off in the hiring process.
- How to effectively measure these KPIs, and mistakes to avoid for a data-driven hiring process.
Recruiting KPIs vs recruiting metrics (and why they’re important)
Before looking at specific hiring indicators, it’s important to clarify a distinction that often causes confusion: recruiting KPIs and recruiting metrics are not the same thing.
Recruiting teams frequently use these terms interchangeably, but they play different roles in understanding hiring performance.
Recruiting KPIs measure hiring outcomes. These are the indicators leadership teams care about most because they reflect the results of your recruiting strategy. Think of quality of hire, time to fill, and offer acceptance rates.
On the other hand, recruiting metrics explain why those outcomes change. They provide context for what’s happening inside your hiring funnel. Metrics like outreach response rate, pipeline conversion, applicant quality, and candidate engagement help recruiters understand what’s influencing their KPIs.
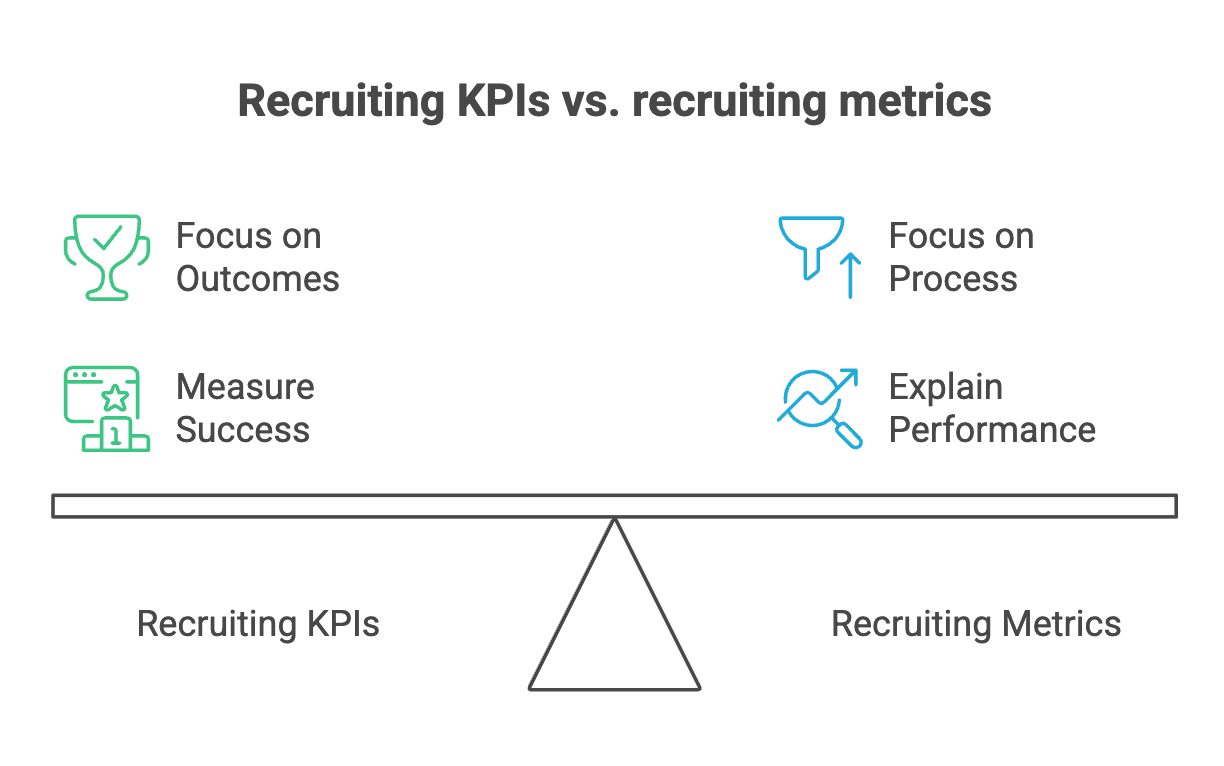
Strong recruiting teams track both. KPIs show the results, while supporting metrics help diagnose the factors that drive those results.
15 recruiting KPIs to measure hiring success (and how to measure them)
Recruiting KPIs help talent acquisition teams understand whether their hiring strategy is actually working. When tracked consistently, they reveal how efficiently roles are filled, whether sourcing channels bring in qualified candidates, and how well new hires perform after joining.
The 15 KPIs in this guide cover four core recruiting dimensions:
- Hiring efficiency: How quickly and effectively roles are filled
- Sourcing effectiveness: Whether recruiting strategies bring in qualified candidates
- Hiring quality: Whether the right candidates are being hired
- Pipeline health and visibility: How candidates move through the recruiting funnel
Together, these indicators give recruiting teams a clearer picture of where their hiring process is performing well and where improvements are needed.
Hiring efficiency KPIs
1. Time to fill
Time to fill measures the number of days between when a role is approved or opened and when a candidate accepts the offer.
A long time-to-fill often signals bottlenecks in the hiring process. These can occur during sourcing, candidate screening, or hiring decision stages.
When roles stay open for extended periods, it affects more than just recruiting metrics. Vacant positions slow down team productivity, delay projects, and increase pressure on existing employees.
As of January 2026, the national average time to fill across industries is between 63–68 days. Organizations that consistently exceed this benchmark may need to evaluate whether sourcing strategies, interview processes, or internal approvals are slowing hiring down.
How you can improve time to fill:
- Build proactive talent pipelines so recruiters already have qualified candidates when roles open
- Standardize interview stages and evaluation criteria to reduce decision-making delays
- Improve sourcing efficiency by prioritizing channels that consistently produce strong candidates
- Reduce scheduling delays by aligning recruiter and hiring manager availability early in the process
Monitoring this KPI consistently helps recruiting teams identify process inefficiencies and shorten hiring cycles without sacrificing candidate quality.
2. Time to hire
While time to fill measures the entire hiring cycle, time to hire focuses on how quickly a candidate moves through the recruiting pipeline once they enter it.
Specifically, it measures the time between a candidate entering the pipeline—such as applying for a role or being sourced—and accepting the job offer.
This KPI reflects how efficient hiring decisions are within the organization. Delays at the interview or approval stage can increase time to hire and lead to losing strong candidates.
Tracking time to hire helps recruiting teams identify delays in interview scheduling, feedback cycles, or decision-making processes so they can move candidates through the pipeline faster.
3. Cost per hire
Cost per hire measures the total cost required to fill a role. It is calculated by dividing the total recruiting costs by the number of hires made during a specific period.
According to SHRM, the average cost per hire is around $4,700.
These costs typically include:
- Recruiter salaries
- Agency or recruiting partner fees
- Job board advertising
- Recruitment marketing expenses
- Recruiting technology and tools
Monitoring this KPI helps organizations evaluate whether their hiring strategies are cost-effective. For example, if certain sourcing channels consistently produce hires at lower costs, recruiting teams can prioritize those channels and reduce unnecessary spending.
4. Recruiting process efficiency
Recruiting process efficiency measures how smoothly candidates move through the hiring process.
Rather than focusing only on speed, this KPI helps recruiters understand whether internal workflows are functioning efficiently.
Common indicators of process inefficiency include:
- Delays in interview scheduling
- Sow hiring manager feedback
- Candidates getting stuck in certain stages of the pipeline
- Extended time between interview rounds
When these issues occur frequently, they create friction in the hiring process and increase the risk of losing top candidates.
That's why it's crucial to track recruiting metrics such as:
- How many candidates are currently in the pipeline
- How quickly candidates move between stages
- The number of offers created and accepted
- Time taken to move from interview to offer
With these insights, recruiting teams can identify bottlenecks early and adjust their hiring process before delays impact hiring outcomes.
Sourcing effectiveness KPIs
5. Source of hire
Source of hire measures which recruiting channels are responsible for successful hires. These channels can include:
- LinkedIn sourcing
- Job boards
- Employee referrals
- Inbound applications
- Recruiting agencies
- Cold candidate outreaches
Tracking source of hire helps recruiting teams understand which channels consistently produce strong candidates and which ones generate low-quality applicants.
For example, if a large percentage of successful hires come from LinkedIn sourcing or employee referrals, teams can prioritize those channels and allocate fewer resources to less effective ones.
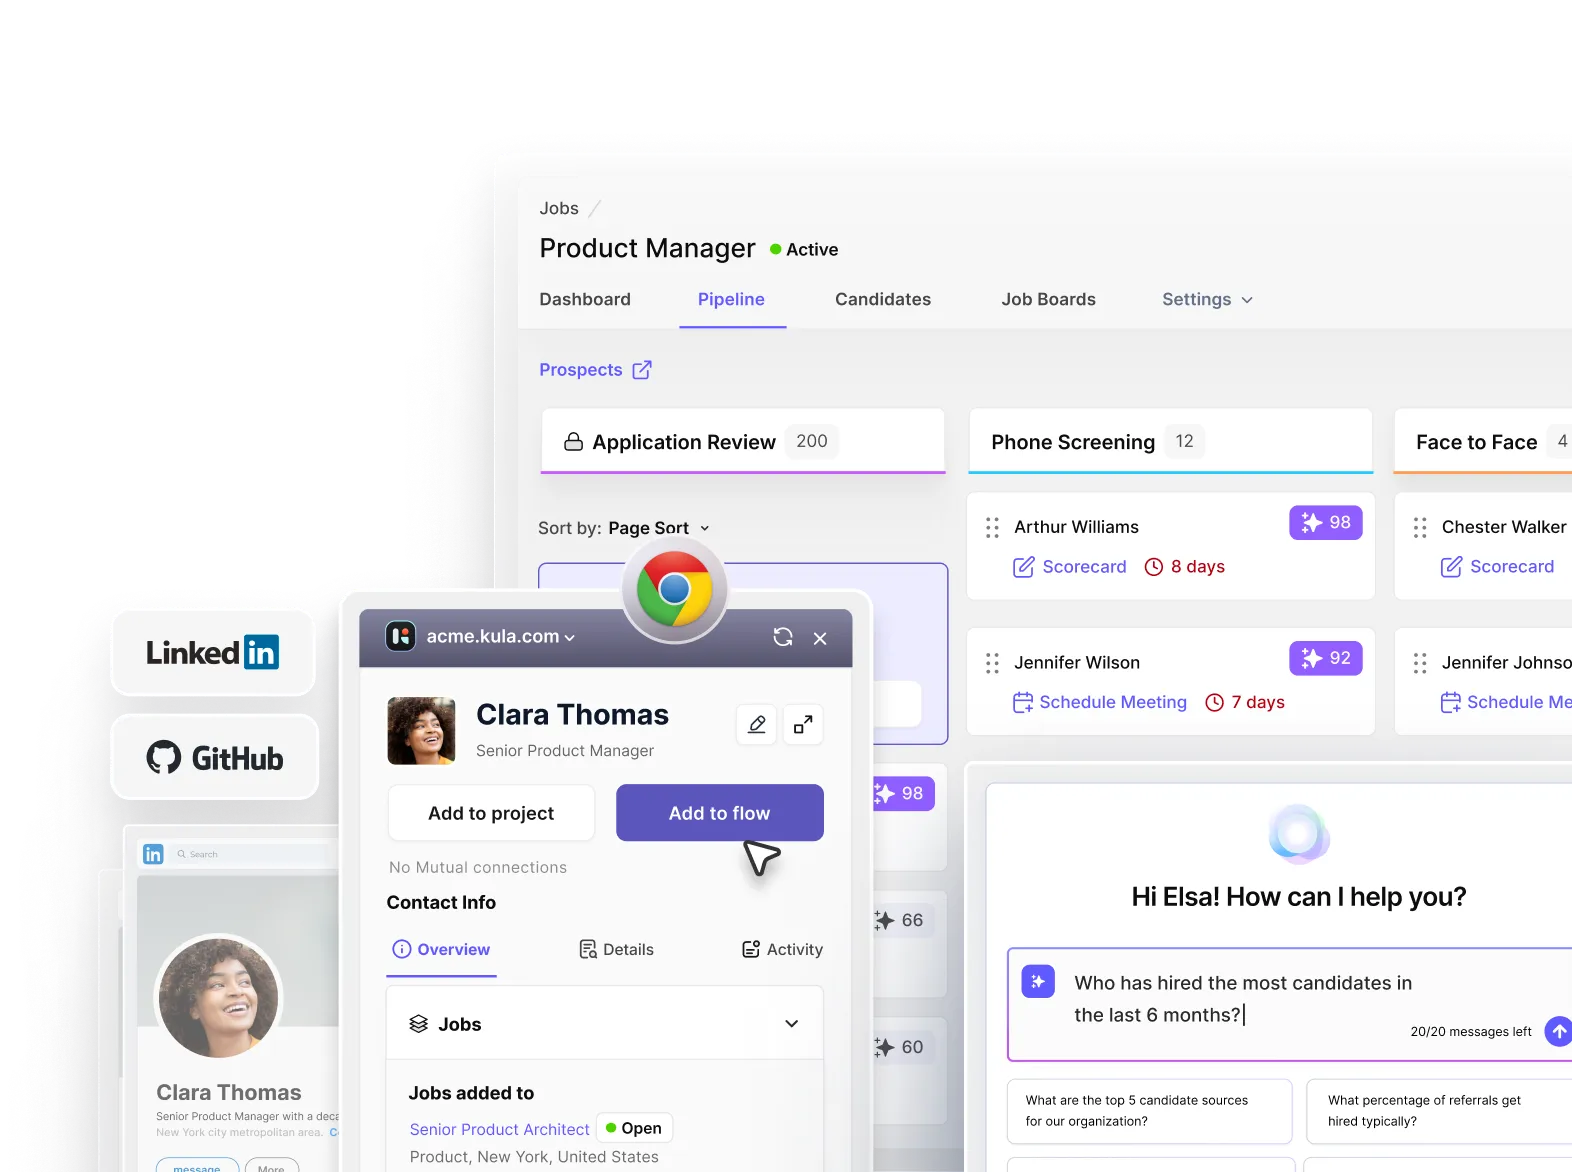
ATS tools like Kula’s LinkedIn Chrome extension make this process much easier. Recruiters can capture candidate profiles directly from LinkedIn and add them to the ATS with all relevant details automatically recorded. This eliminates manual data entry and keeps sourcing activity organized within the recruiting system.
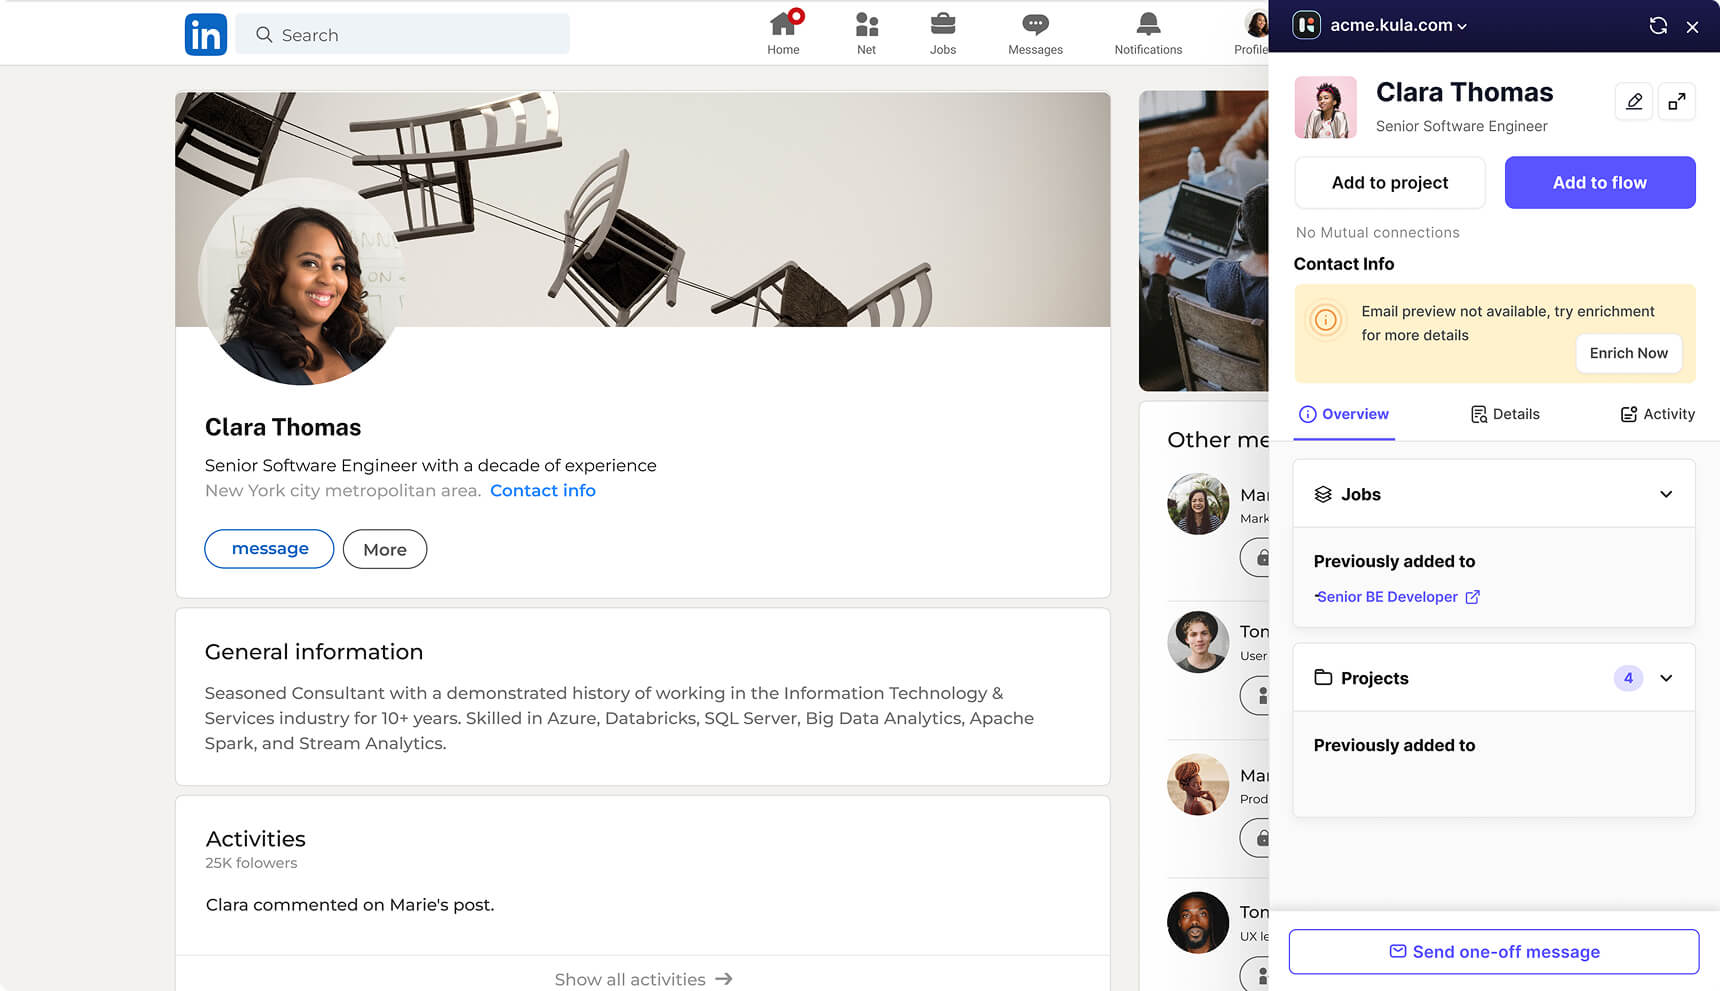
At the same time, Kula’s analytics dashboards track where candidates and hires are coming from, giving recruiting teams visibility into which channels are producing the best results.
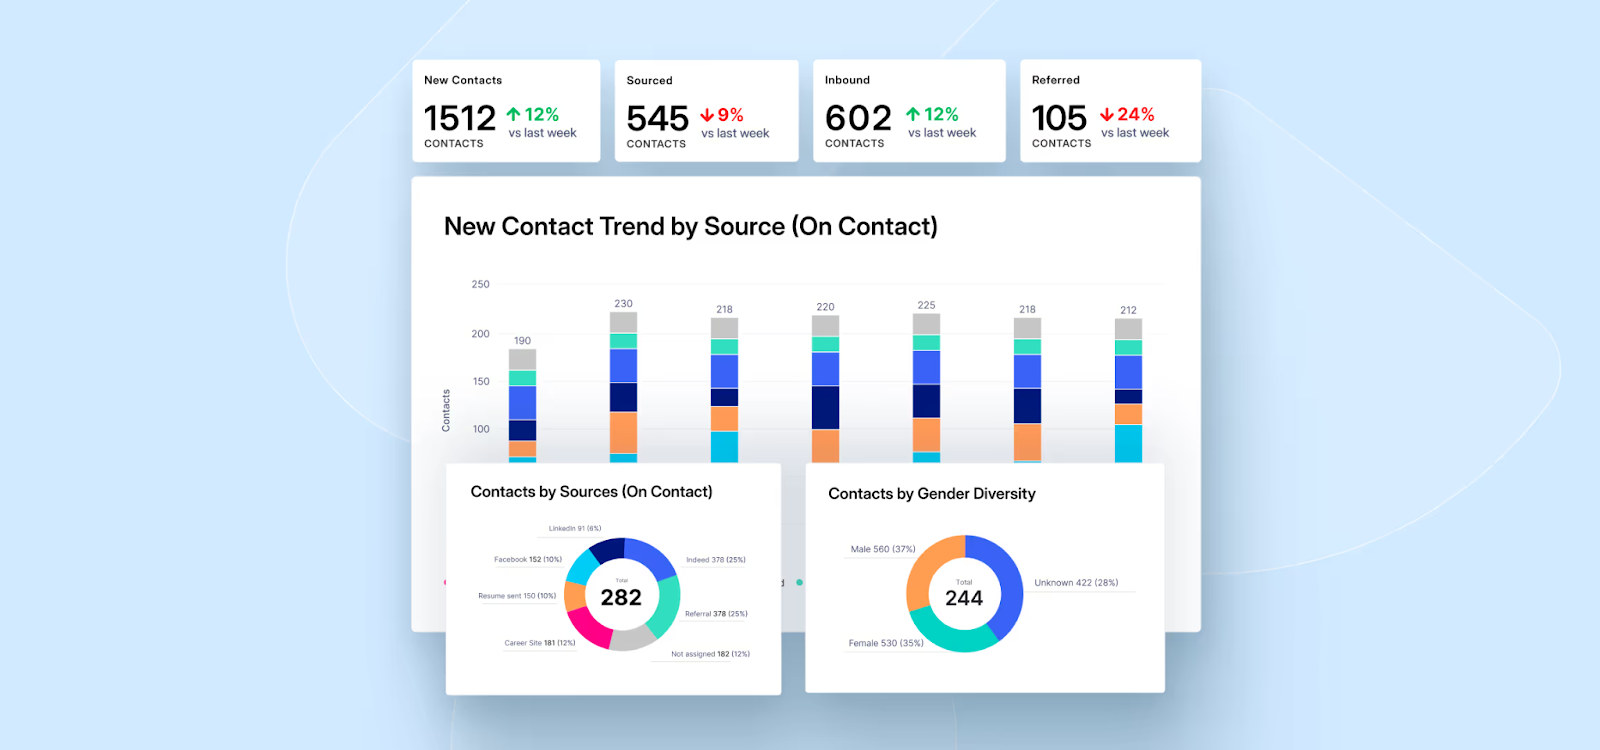
Over time, these insights help teams refine their sourcing strategy and focus on the channels that consistently deliver high-quality candidates.
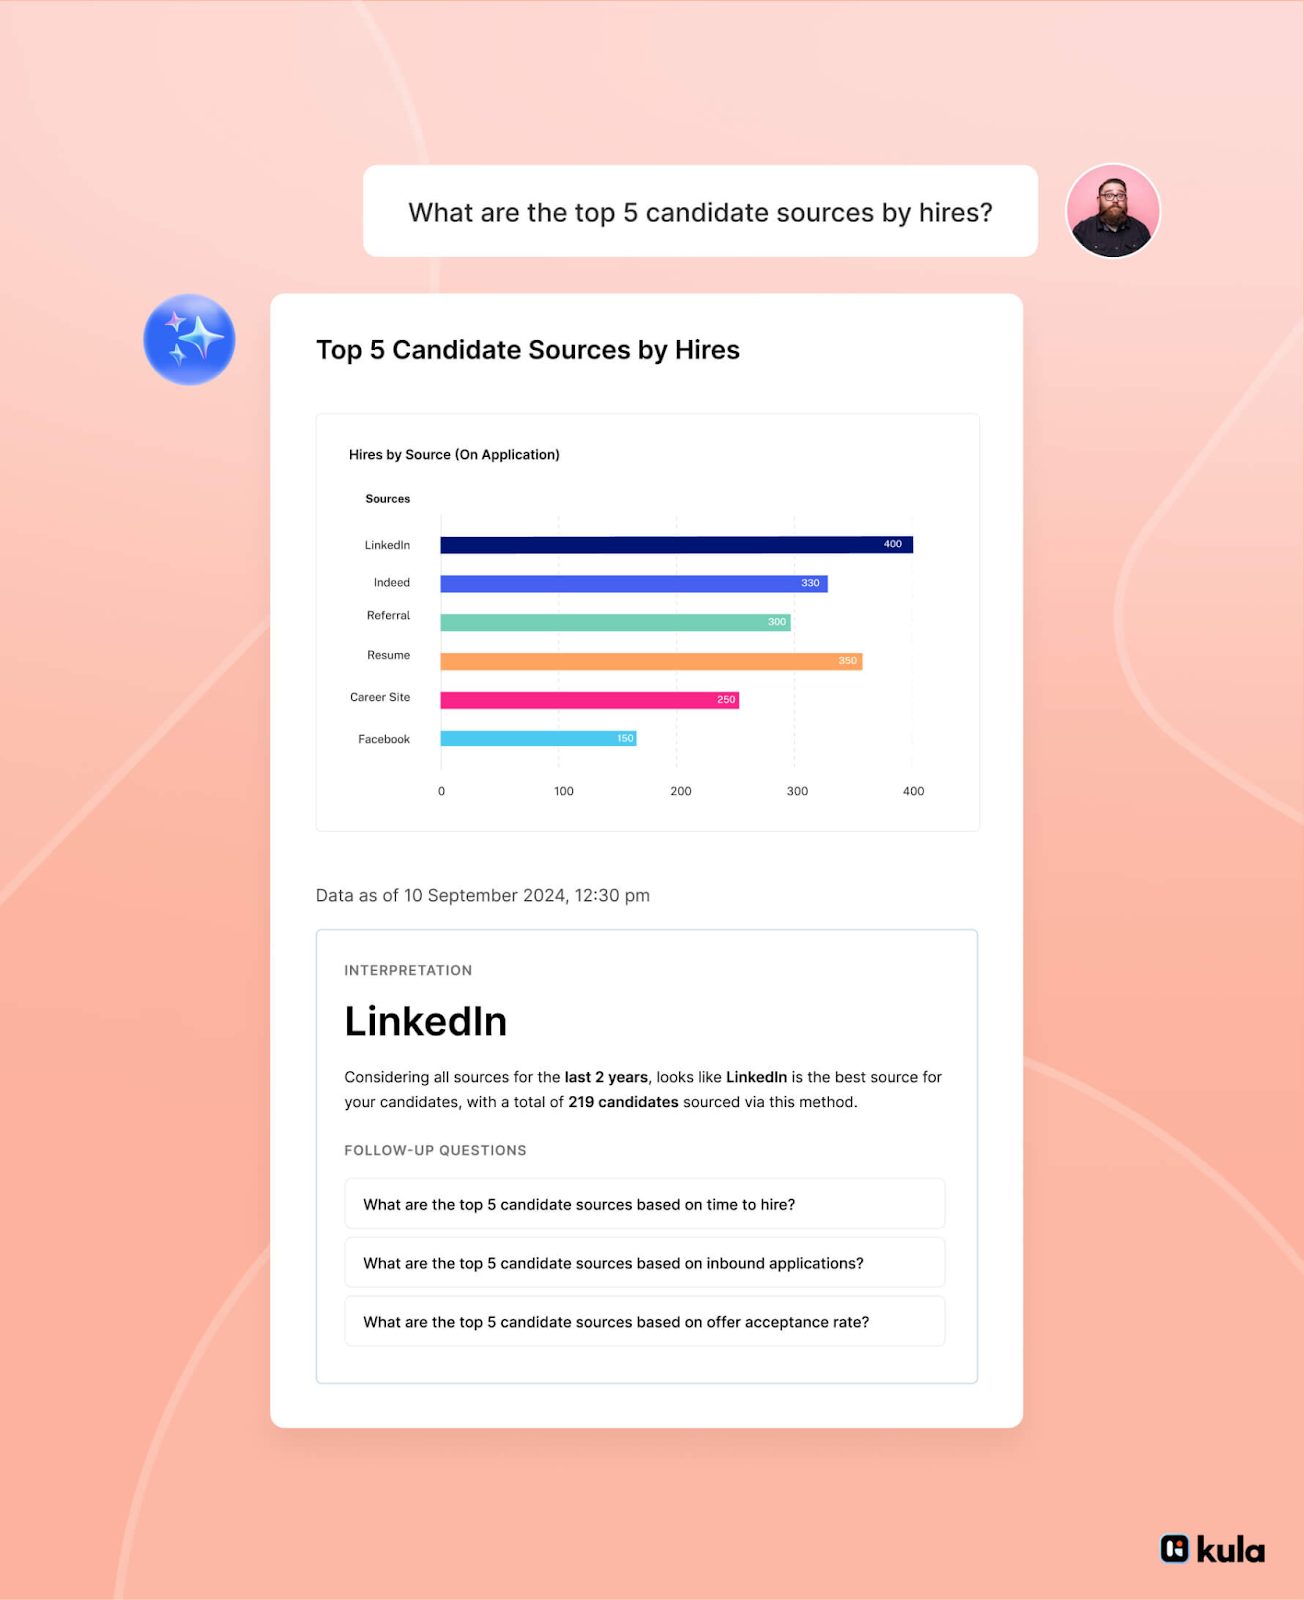
To make it even easier, you can use Kula’s Conversational Analytics to generate a performance comparison among all the source channels:
6. Employee referral rate
Employee referral rate measures the percentage of hires that come from employee referrals.
Employee referral rate = referral hires ÷ total hires.
Referrals are often one of the most effective recruiting channels. Referred candidates tend to move through the hiring process faster, demonstrate stronger cultural alignment, and stay longer at the company.
7. Outreach response rate
Outreach response rate measures the percentage of candidates who respond to recruiting messages. The formula for calculating your outreach response rate is:
Replies ÷ messages sent
For example, if you send 100 LinkedIn InMails in a week, but only receive 5 replies, your outreach response rate is 5%, meaning your messaging needs some work.
This KPI helps recruiters understand whether their outreach strategy is working. A low response rate can indicate problems such as poor candidate targeting, generic messaging, or outreach sent to the wrong audience.
On the other hand, a strong response rate suggests that recruiters are reaching relevant candidates with messaging that resonates.
Monitoring outreach response rates allows recruiting teams to refine their sourcing strategy by:
- Improving candidate targeting
- Testing different outreach messaging
- Personalizing communication
Over time, analyzing these patterns helps recruiters improve engagement with passive candidates and generate stronger pipelines for open roles.
Visibility and discoverability metrics (supporting metrics)
Not all recruiting indicators are KPIs. Some metrics act as supporting signals that influence sourcing outcomes but don’t directly measure hiring success.
This is what we call visibility and discoverability metrics.
These indicators show how visible recruiters are to potential candidates before any outreach begins. If recruiters or hiring teams have low visibility on professional networks, it can limit how often candidates discover them or engage with their opportunities.
For example, recruiter profile views, search appearances, and connection growth, are all visibility or discoverability metrics.
While these metrics don’t measure hiring outcomes directly, they can influence sourcing performance by increasing the likelihood that candidates notice, recognize, and respond to recruiter outreach.
Hiring quality KPIs
- These KPIs determine whether the right candidates are being hired.
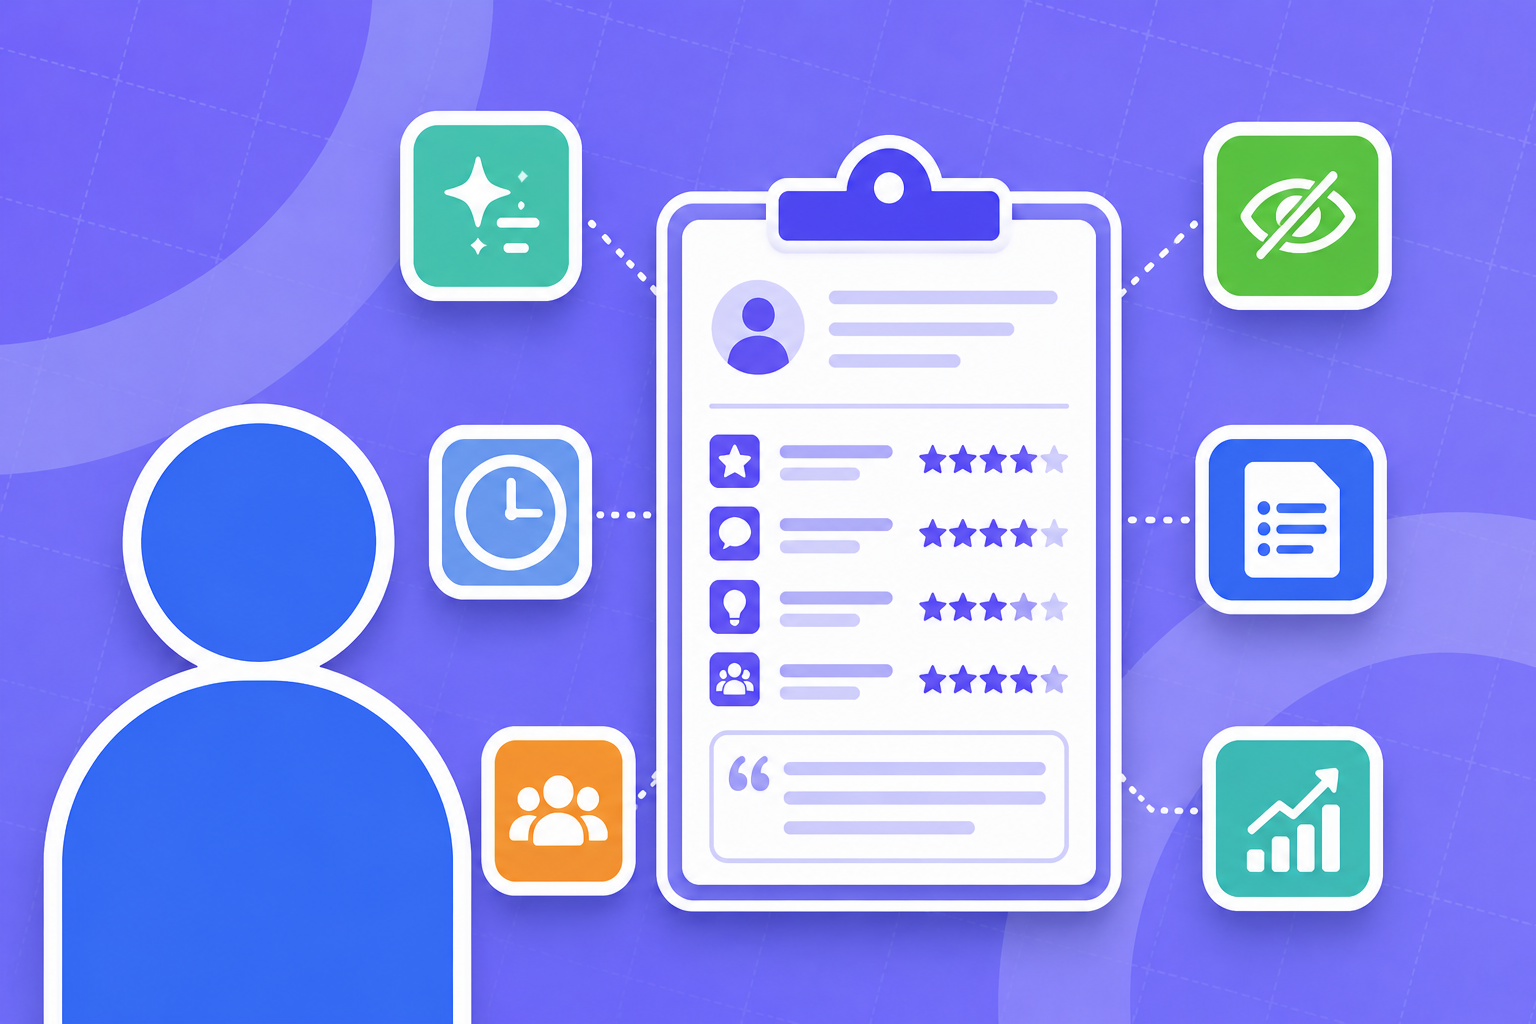
8. Quality of hire
Quality of hire measures how well new hires perform and contribute to the organization after they join.
According to Kula’s 2025 State of Recruiting Report, 63% of recruiters say quality of hire is their most important KPI.
This metric focuses on long-term outcomes rather than short-term hiring speed. It helps organizations evaluate whether recruiting efforts are bringing in candidates who perform well, stay longer, and align with team expectations.
Common indicators used to measure quality of hire include:
- Performance reviews
- Employee retention rate
- Hiring manager satisfaction
- Ramp time
Unlike other recruiting KPIs, there is no universal formula for measuring quality of hire. The metric often combines multiple data points to create a more complete picture of new hire performance.
Many companies use composite scoring models that combine different indicators, for example:
(Performance score + retention score + hiring manager rating) ÷ 3
In practice, recruiting teams measure this KPI in several ways.
For example, we found on Reddit that some recruiters track quality of hire through 30/60/90-day check-ins, while others rely on performance review data or evaluate whether new hires achieved the objectives expected in their roles.
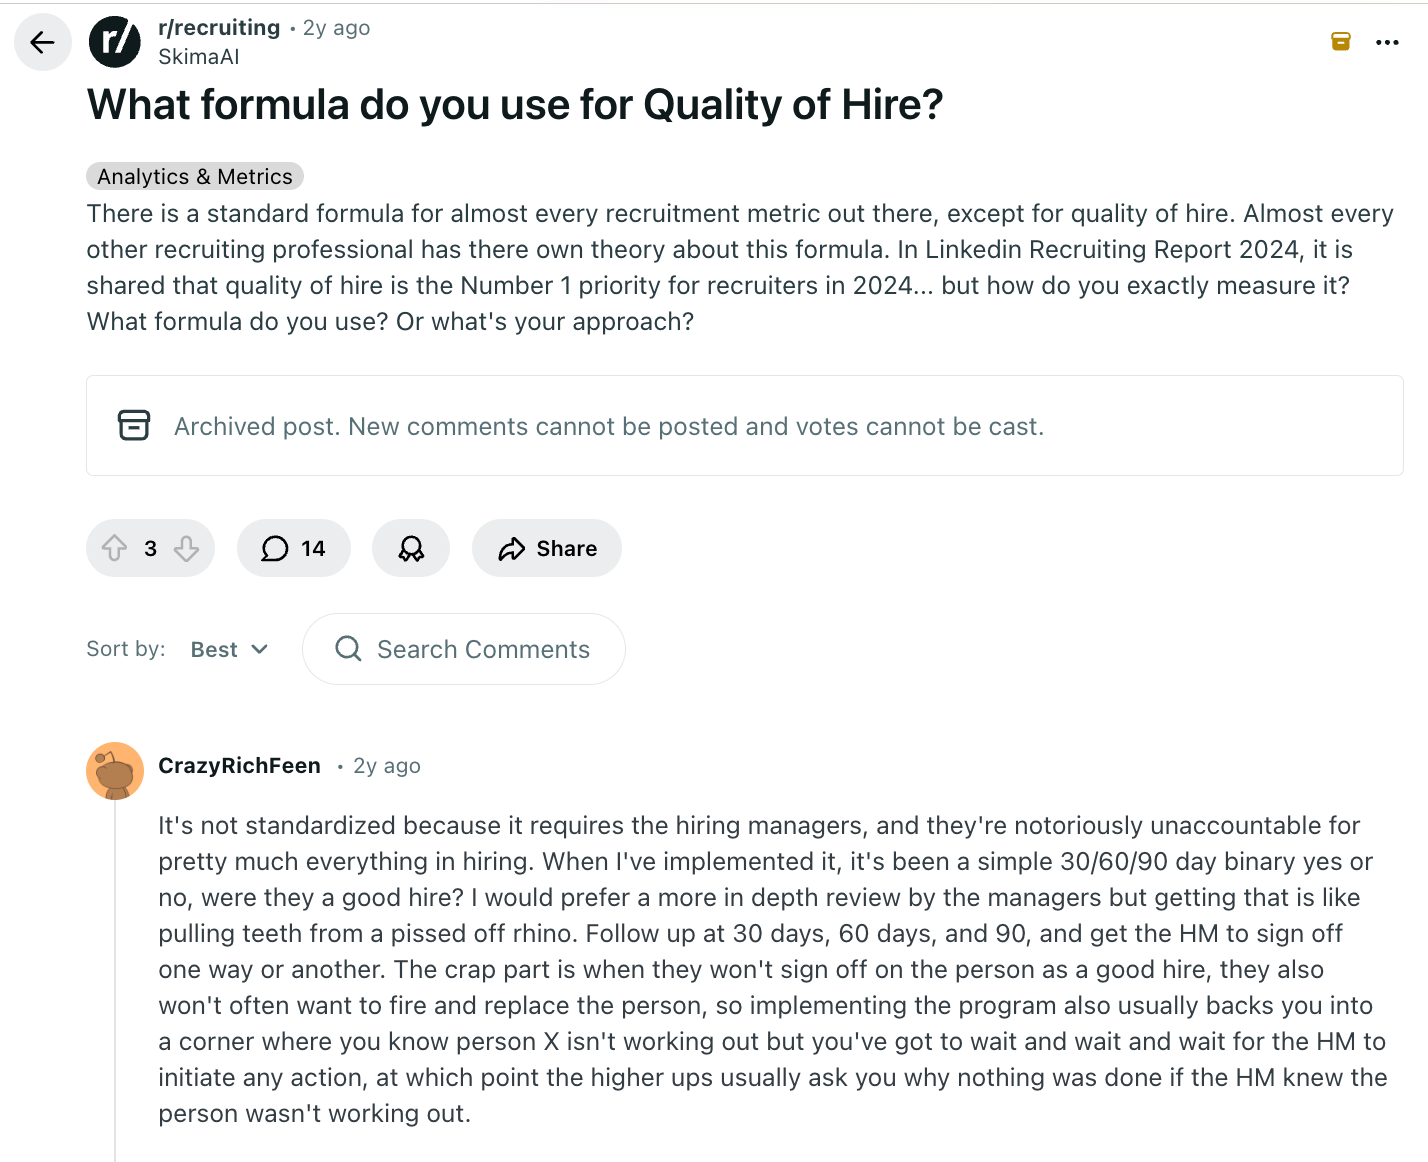
The key for measuring your quality of hire is always consistency. Using the same indicators across hires so recruiting teams can identify patterns and improve their hiring decisions over time.
9. Applicant quality rate
While quality of hire measures performance after someone joins the company, applicant quality rate helps evaluate candidate quality earlier in the hiring process.
According to Kula’s 2025 State of Recruiting Report, 59% of recruiters say they struggle with a shortage of qualified candidates. Tracking applicant quality helps recruiting teams understand whether their sourcing strategies are attracting the right candidates in the first place.
This metric measures the percentage of applicants who progress to the interview stage.
You can measure your applicant quality rate by calculating:
Candidates reaching interview stage ÷ total applicants
For example, if 100 candidates apply for a role and 20 move forward to interviews, the applicant quality rate would be 20%.
A low applicant quality rate often signals issues with sourcing strategies, job descriptions, or targeting. On the other hand, a strong rate suggests that recruiting channels are attracting candidates who meet the role requirements.
Keep in mind that this metric does not replace quality of hire. Instead, it complements it by helping teams evaluate candidate quality earlier in the recruiting funnel.
10. Candidate retention rate
Candidate retention rate measures the percentage of new hires who remain with the company after a defined period (which is usually 12 months).
This KPI helps organizations evaluate whether hiring decisions are producing long-term employee success.
Retention is particularly important because turnover is expensive. According to Gallup, replacing an employee can cost up to twice their annual salary when recruiting, training, and lost productivity are considered.
A strong retention rate often indicates that recruiting teams are selecting candidates who are a good fit for the role and the organization. Conversely, high early attrition can signal problems with sourcing quality, job expectations, or cultural alignment.
Because of this, retention rate also provides insight into the effectiveness of sourcing and screening strategies, helping recruiting teams refine how they identify and evaluate candidates.
Hiring process quality and candidate experience KPIs
11. Offer acceptance rate
Offer acceptance rate measures the percentage of candidates who accept a job offer after it has been extended.
The formula to measure your offer acceptance rate is:
Accepted offers ÷ total offers
A high offer acceptance rate usually indicates that candidates feel confident about the opportunity and their experience throughout the hiring process. On the other hand, a low acceptance rate often signals issues earlier in the pipeline.
Some of the most common causes of low offer acceptance include:
- Slow hiring processes that cause candidates to lose interest or accept competing offers.
- Compensation misalignment between candidate expectations and the offer presented.
- Weak candidate engagement during the recruiting process.
In many cases, offer acceptance is influenced long before the offer stage. Poor communication, unclear role expectations, or delayed feedback during earlier stages can affect how candidates feel about the opportunity.
That’s why improving candidate experience throughout the hiring process often leads to stronger offer acceptance rates.
More importantly, keeping candidates engaged throughout the hiring process is what helps boost your chances of offer acceptance. Hiring teams can keep candidates engaged by sending consistent updates on where they stand in the recruiting process.
Even a simple update like “Your application has been reviewed,” can keep candidates engaged and reduce their chances of ghosting you, or considering other employers.
When a candidate moves from application review to screening or interview stages, Kula can automatically send status updates, interview confirmations, or next-step emails so candidates stay informed without recruiters having to manually follow up.
12. Candidate experience score
Candidate experience score measures how candidates perceive the hiring process from application to final decision.
Candidate experience has a direct impact on hiring outcomes. According to a 2025 Career Plug report, 66% of candidates say a positive hiring experience would influence them to accept a job offer, while 26% have declined offers due to poor experiences, such as unclear job expectations or poor communication.
Recruiting teams typically measure candidate experience using methods like:
- Candidate surveys
- Candidate Net Promoter Score (NPS)
- Post-interview feedback forms
These insights help recruiters identify areas where the hiring process can improve, whether that involves clearer communication, better scheduling coordination, or more transparency during interviews.
Instead of candidates waiting for manual updates, they automatically receive timely emails or messages confirming application status, interview scheduling, or next steps.
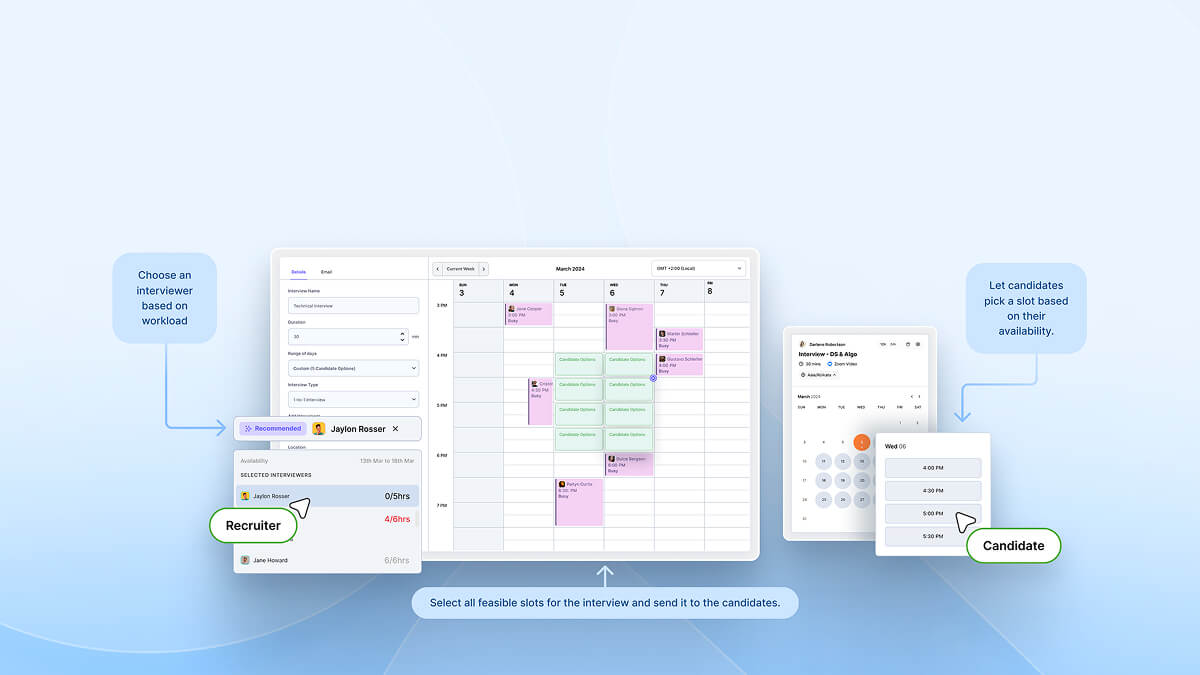
Kula also simplifies interview coordination through self-scheduling, allowing candidates to choose available interview slots directly from the recruiter’s calendar. This eliminates the back-and-forth emails that often delay interviews and frustrate candidates.
13. Candidate drop-off rate
Candidate drop-off rate measures the percentage of candidates who abandon the hiring process before completing it.
Research suggests that around 60% of candidates drop off due to overly complex or time-consuming application processes. When the hiring process becomes difficult to navigate, candidates are far more likely to disengage.
And nearly 4 in 5 candidates say the hiring experience they receive is an indicator of how a company values its people.
Common causes of candidate drop-off include:
- Long or complicated application forms
- Poor communication during the hiring process
- Slow interview scheduling or feedback cycles
In fact, improving candidate engagement throughout the pipeline is becoming a growing priority.
According to Kula’s 2025 State of Recruiting Report, 21% of hiring leaders are prioritizing recruiting technology that improves candidate experience and engagement.
Automatically sending updates like “Your application has moved to the next stage” or “Here’s what to expect in your upcoming interview” eliminates uncertainty.
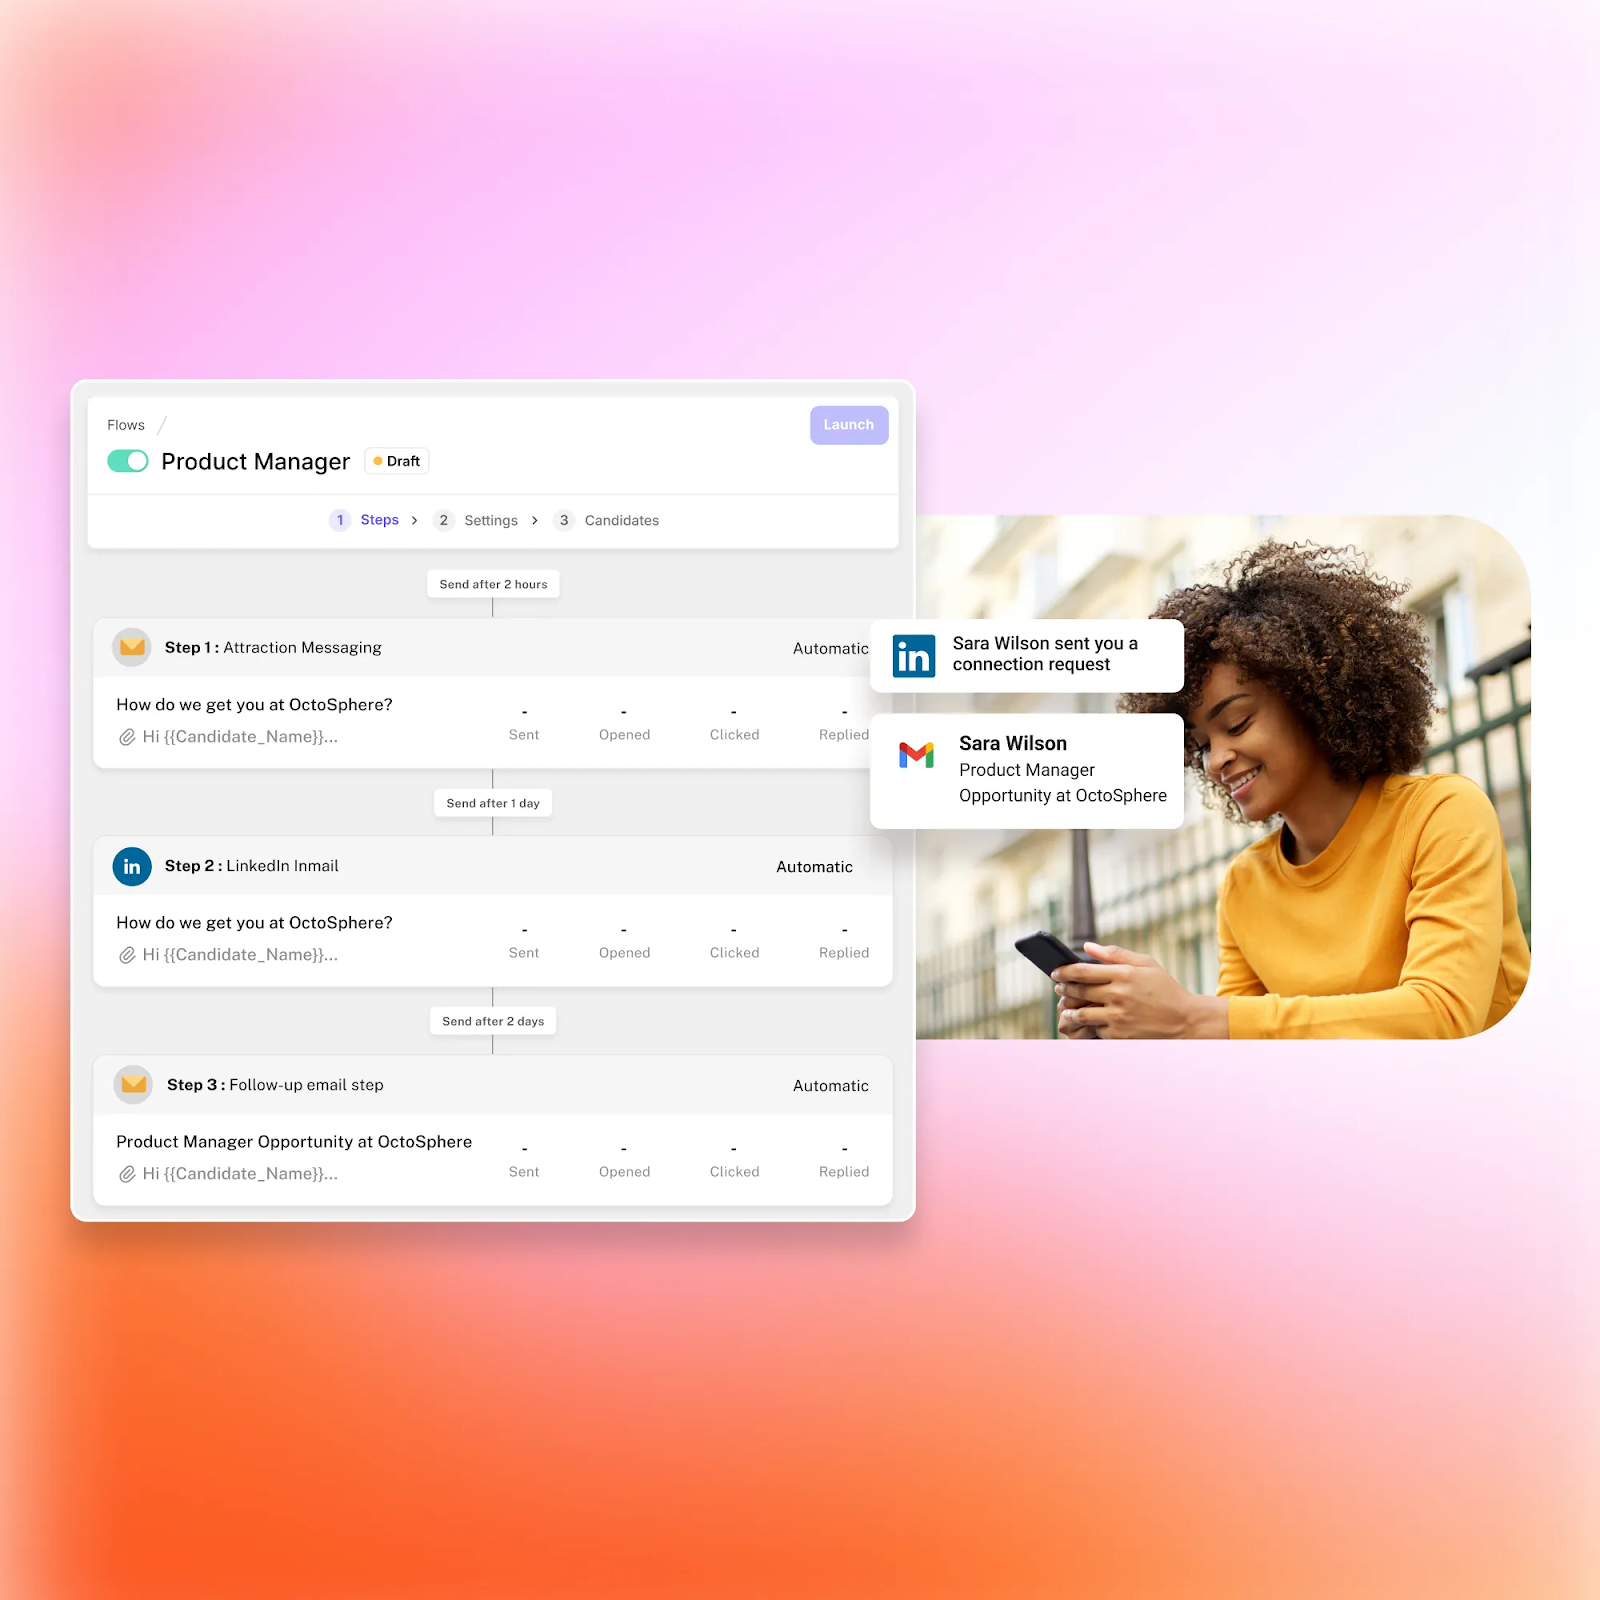
By building structured, multichannel engagement campaigns, recruiting teams can maintain relationships with passive candidates, nurture long-term talent pipelines, and reduce drop-off throughout the hiring process.
Predictive analytics in recruiting
Predictive analytics refers to the use of historical recruiting data, statistical models, and machine learning to forecast hiring outcomes and identify patterns in candidate success.
Instead of only looking at past performance metrics, predictive analytics helps recruiting teams anticipate future hiring outcomes—for example, which candidates are most likely to succeed in a role, which sourcing channels produce the highest-performing hires, or where candidates are most likely to drop off in the pipeline.
In practice, predictive analytics can help answer questions such as:
- Which candidate profiles historically perform best in a specific role?
- Which sourcing channels consistently produce high-performing hires?
- Which candidates are most likely to progress through the hiring funnel?
The impact is straightforward:
- Stronger candidates are identified and engaged earlier
- Recruiters spend less time filtering out obvious mismatches
- High-quality profiles are less likely to be lost during volume spikes
This helps recruiters quickly identify high-potential candidates within large applicant pools and prioritize the ones most likely to succeed in the role.
Over time, combining predictive insights with recruiting KPIs allows teams to move beyond reactive hiring decisions and build more data-informed recruiting strategies.
Pipeline health metrics that explain KPI changes
Pipeline health metrics help recruiters diagnose where candidates are getting stuck or dropping off in the process. These indicators don’t function as primary KPIs but provide valuable insight into why hiring performance is changing.
Common pipeline health indicators include:
- Pipeline size: The total number of candidates currently in the recruiting funnel.
- Candidates per stage: How candidates are distributed across stages like screening, interviews, and offers.
- Stage conversion rates: The percentage of candidates progressing from one stage to the next.
Monitoring these metrics helps recruiting teams identify bottlenecks early and adjust their process before delays affect hiring outcomes.
Focus on conversion metrics, not activity metrics
Many recruiting teams track activity metrics because they are easy to measure. However, activity alone does not indicate whether hiring efforts are actually producing results.
Activity metrics measure the amount of work being done. Examples include:
- Messages sent
- Connections added
- Job posts published
While these numbers show recruiter effort, they don’t reveal whether those efforts are successfully moving candidates through the hiring process.
Conversion metrics, on the other hand, measure how candidates progress through the recruiting funnel. These include
- Response rate
- Interview rate
- Offer acceptance rate
- Final hires
These metrics provide clearer insight into recruiting performance because they show whether sourcing, outreach, and interview processes are leading to successful hires.
Strong recruiting teams focus less on raw activity and more on how effectively candidates move from one stage of the hiring funnel to the next. Tracking conversion metrics helps identify bottlenecks, refine outreach strategies, and ultimately improve hiring outcomes.
Common mistakes when tracking recruiting KPIs
Tracking recruiting KPIs can improve hiring outcomes, but only if the right indicators are measured and interpreted correctly. Many teams collect recruiting data but still struggle to turn it into meaningful insights.
Some of the most common mistakes include:
- Tracking activity instead of conversions: Measuring activity like messages sent or candidates sourced may show recruiter effort, but it doesn’t indicate whether those efforts are leading to interviews or hires. Conversion metrics provide a clearer view of recruiting effectiveness.
- Measuring outreach volume instead of engagement: Sending hundreds of messages doesn’t necessarily improve hiring outcomes. What matters more is whether candidates respond, engage with the opportunity, and move forward in the hiring process.
- Ignoring pipeline conversion rates: If candidates consistently drop off between stages—such as from screening to interview—it signals a problem in the hiring funnel. Without tracking stage conversion rates, these issues often go unnoticed.
- Reviewing metrics too infrequently: Recruiting metrics should be reviewed regularly, not just at the end of a quarter. Frequent monitoring helps teams identify bottlenecks early and adjust their hiring strategy before delays affect hiring outcomes.
- Not connecting sourcing metrics to hiring outcomes: Knowing where candidates come from is useful, but the real insight lies in understanding which channels produce candidates who progress through the pipeline and ultimately get hired.
Avoiding these mistakes helps recruiting teams focus on the metrics that actually improve hiring performance rather than simply generating more recruiting data.
Start tracking your recruiting KPIs
Recruiting generates a lot of data, but not all of it leads to better hiring decisions.
What matters most is tracking the KPIs that show how candidates move through your hiring funnel and whether your recruiting strategies are actually working.
Platforms like Kula help bring these insights together by giving recruiting teams clear visibility into sourcing, outreach, and pipeline performance in one place.
If you’re looking to build a more data-driven, AI-powered hiring process, Kula helps you track the metrics that matter, streamline your recruiting workflows, and make smarter hiring decisions faster.
Start building a more efficient recruiting process with Kula today.
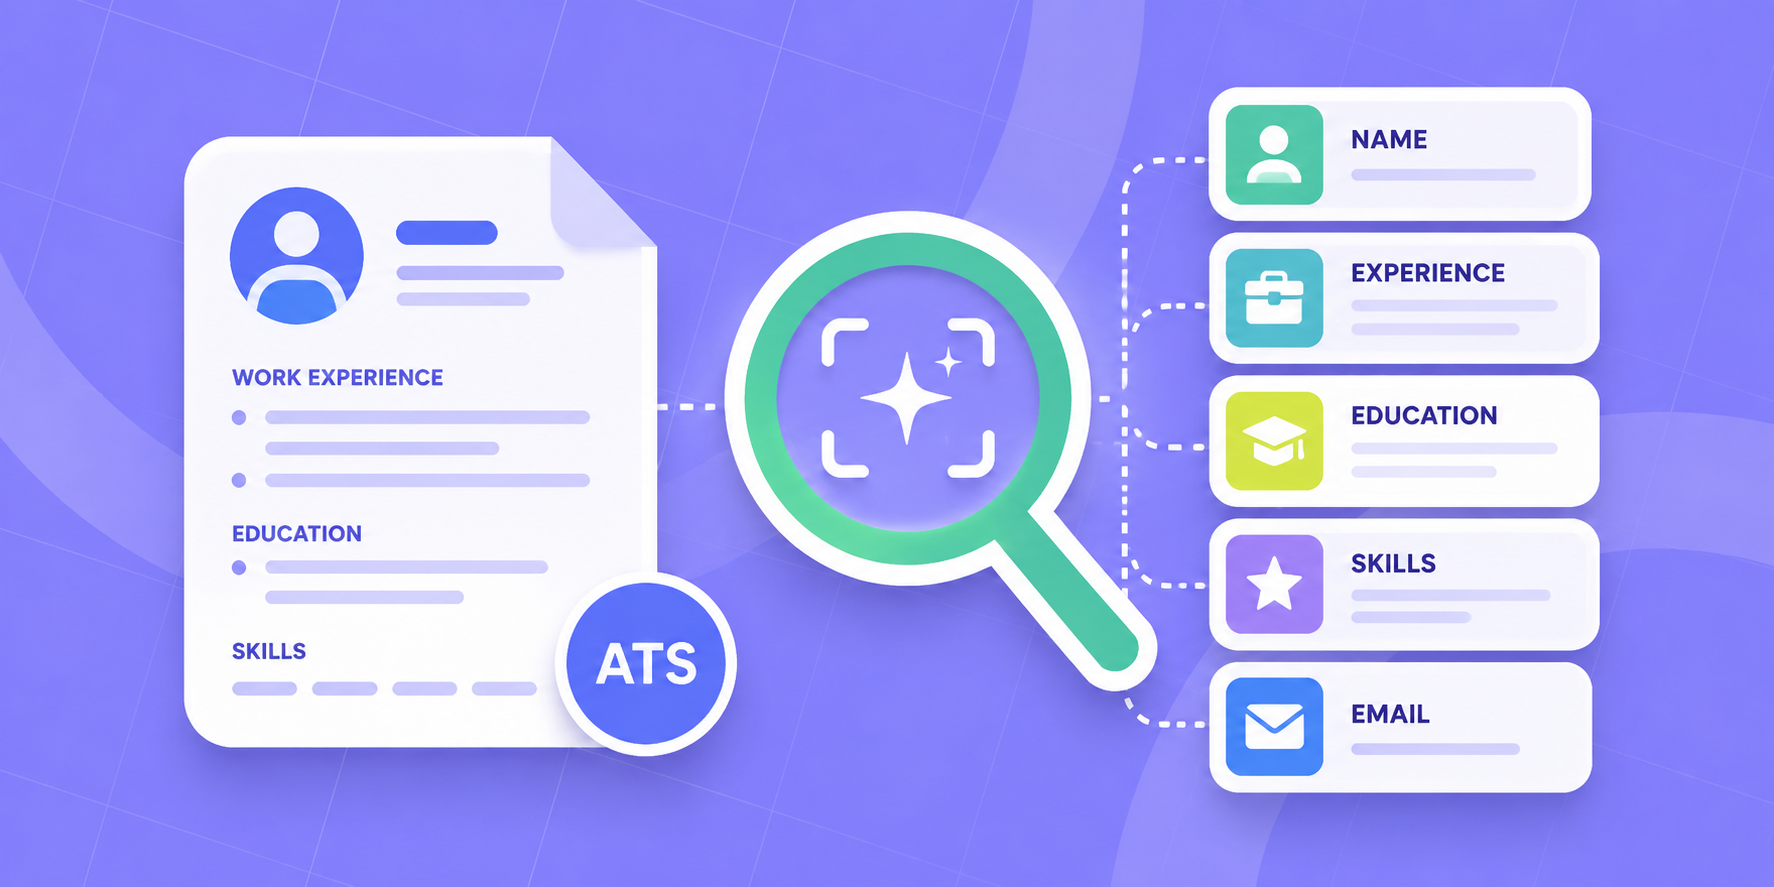
A recruiting KPI (key performance indicator) is a measurable metric used to evaluate how effective a company’s hiring process is. These indicators help talent acquisition teams track outcomes such as hiring speed, candidate quality, and overall recruiting efficiency. Common recruiting KPIs include time to fill, quality of hire, offer acceptance rate, and source of hire. By monitoring these indicators, recruiting teams can identify bottlenecks in the hiring process, improve sourcing strategies, and make more informed hiring decisions.
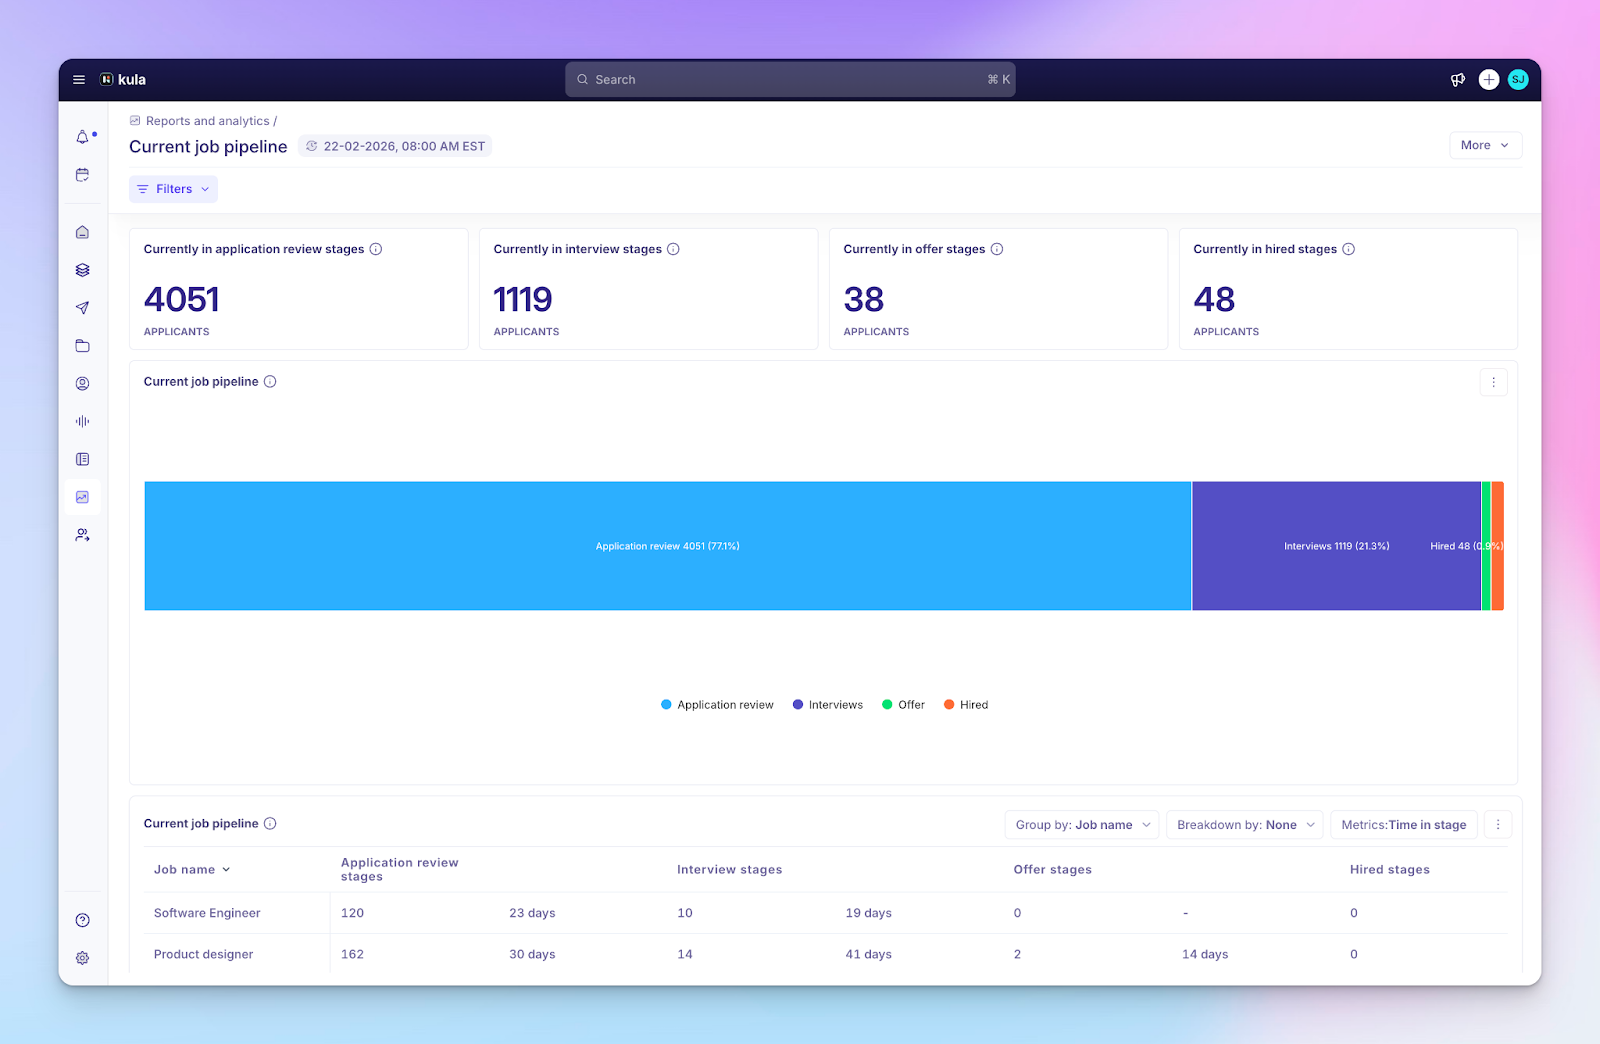
Most HR and recruiting teams rely on dashboards that provide real-time visibility into hiring performance, such as pipeline health, source of hire, and hiring velocity. Platforms like Kula provide AI-powered reports and analytics with customizable dashboards that help teams track recruiting KPIs in one place. Recruiters can monitor pipeline activity, generate tailored reports, and surface insights quickly using conversational AI. Kula’s AI Scoring also help prioritize strong candidates by evaluating profiles against role requirements, making it easier for teams to make data-driven hiring decisions.
Key performance indicators in talent acquisition are metrics used to measure the success and efficiency of a company’s hiring strategy. These KPIs help organizations understand how well they attract, evaluate, and hire candidates. Examples of talent acquisition KPIs include: Time to fill: How long it takes to fill open roles Source of hire: Which channels produce successful hires Offer acceptance rate: How often candidates accept offers Quality of hire: How well new employees perform after joining Tracking these KPIs helps recruiting teams optimize their hiring processes and improve overall hiring outcomes.
While the most important KPIs vary by organization, three metrics are widely considered essential for measuring recruiting success: Time to fill: Measures hiring efficiency and how quickly roles are filled Quality of hire: Evaluates how well new hires perform and contribute to the organization Offer acceptance rate: Indicates how successful the hiring process is at converting candidates into employees Together, these KPIs provide a balanced view of recruiting performance by measuring speed, quality, and candidate engagement.
Several recruiting KPIs help evaluate quality of hire, which measures how successful new employees are after joining an organization. Common indicators include: Performance review scores Employee retention rate Hiring manager satisfaction Ramp time (how quickly new hires become productive) Many organizations combine these indicators into a composite score to evaluate hiring success. Monitoring these metrics helps recruiting teams refine their sourcing strategies and improve candidate selection over time.