Most teams track hiring metrics but still struggle to improve outcomes. Reporting alone doesn’t lead to better hiring. It often shows what happened, but not what needs to change.
Without clear diagnosis, data becomes noise. Teams may have reports but still lack clarity on where candidates drop off, which roles are delayed, or what actions to take next.
The purpose of reporting is to identify bottlenecks and support better decisions.
These recruiting report templates help structure your data, highlight gaps, and make it easier to improve hiring efficiency, candidate experience, and overall outcomes.
Let’s get started.
What is a recruiting report template?
Think of a recruiting report template as your cheat sheet to make sense of all the candidate data you receive. Let’s understand this with an example.
Suppose you’ve posted an opening. You may find dozens, maybe hundreds of applications for the position. Now, you have to be on top of the constant juggling of candidate profiles and tackle the challenge of evaluating your team's performance while measuring the effectiveness of our strategies.
This is a lot to manage, and it's easy to feel buried under a mountain of data.
So, how do you bring order to this chaos?
A well-designed recruiting report template is a framework that helps you consistently capture, organize, and analyze your hiring data.
It's designed to highlight the metrics that matter most to your organization, whether that's time-to-hire, cost-per-hire, or quality of candidates.
A great template doesn't just show you what happened. It helps you understand why it happened and, more importantly, what you should do next.
To put it simply, it's the difference between saying, "We hired 10 people last month" and "Our engineering hires are taking 20% longer than other departments, and here's why."
What good recruiting reporting looks like
Most recruiting teams think reporting means tracking numbers. It doesn’t. Tracking tells you what’s happening, but reporting should explain why it’s happening and what to do next.
A good recruiting report goes beyond activity and answers three critical questions:
- The first is tracking: What’s happening—Tracking raw inputs like applications, interviews, and hires
- The second is reporting: Why it’s happening—where patterns start to emerge, such as drop-offs in the funnel, delays between stages, or low conversion rates.
- The third is action: What action needs to be taken to improve outcomes—where those insights translate into decisions, like fixing sourcing channels, reducing interview rounds, or addressing hiring manager delays?
A good recruiting report template also makes sure that insights are not only visible but usable. It should be
- Timely, so decisions are based on current data rather than outdated snapshots
- Specific, focusing only on metrics that directly impact hiring outcomes instead of vanity numbers
- Actionable, making it clear what needs attention and what should change next.
That’s the real difference: most reports organize data, but good reporting drives clarity, and great reporting drives action.
A Diagnostic Framework for Recruiting Reports
A simple way to structure your recruiting reports is by using this 4-step diagnostic loop:
- Define the metric → Start with one clear metric (e.g., time-to-hire, offer acceptance rate) instead of looking at everything at once
- Compare vs benchmark → Evaluate it against past performance, role-specific targets, or industry benchmarks to understand if it’s actually a problem
- Identify drop-offs → Break the recruiting metrics down to find where the issue is happening (e.g., delays at the interview stage, low conversion from offer to acceptance)
- Take action → Based on the root cause, decide what needs to change (e.g., improve screening, reduce interview rounds, adjust compensation)
For example, if time-to-hire has increased, the report alone doesn’t help. But using this loop, you might discover that interview scheduling is delayed due to hiring manager availability, leading to a clear action like setting feedback SLAs or automating scheduling.
Top metrics to include in a recruiting dashboard
1. Time-to-hire
This is the average time it takes from when a candidate enters your pipeline to when they accept an offer. You can break it down into stages:
- Time to screen: How long does it take your team to review applications?
- Time to first interview: Are you quick to engage promising candidates?
- Time between interviews: Is your process dragging on unnecessarily?
- Time to offer: Once you've decided, how fast can you pull the trigger?
By tracking each of these, you can pinpoint bottlenecks. Take, for instance, a company whose time between interviews was sky-high. Turns out, their hiring managers were swamped and couldn't schedule follow-ups. Tracking the right metrics can help them implement a new scheduling system and cut their overall time-to-hire.
Compare your time-to-hire across different roles and departments. You might find that some positions consistently take longer to fill, which could indicate a need to adjust your sourcing strategy or job requirements for just that kind of role.
2. Source of hire
This tracks where your successful candidates are coming from. But don't just look at the raw numbers. You need to analyze:
- Quality of hires from each source: Are referrals outperforming job board hires?
- Cost-effectiveness: Which sources give you the best ROI?
- Time-to-hire by source: Do candidates from certain sources move through your pipeline faster?
This allows you to see not just where candidates are coming from but which sources are producing your best hires.
For instance, a tech startup has been pouring money into expensive niche job boards. When they dug into their data, they found that their best engineers were coming from hackathons and coding competitions, not niche job boards. Subsequently, they shifted their strategy and saw a 40% increase in the quality of technical hires.
3. Offer acceptance rate
This is the percentage of candidates who accept your job offers. But there's more to it than just that number. You should be looking at:
- Acceptance rate by role: Are certain positions harder to close?
- Acceptance rate by recruiter: Do some team members have a knack for closing deals?
- Reasons for declined offers: Is it always about money, or are there other factors?
4. Quality of hire
Quality of hire is arguably the most important metric but also the trickiest to measure. Here's how to break it down:
- Performance ratings: How do new hires score in their first year?
- Retention rate: Are your new hires sticking around?
- Time to productivity: How quickly are new hires getting up to speed?
- Hiring manager satisfaction: Are the people who requested the hire happy with the result?
5. Diversity metrics
These aren’t just about meeting quotas. A truly useful diversity metric should cover the following:
- Diversity of applicant pool: Are you attracting a diverse range of candidates?
- Diversity at each stage of the hiring process: Where are diverse candidates dropping off?
- Intersectionality: Are you considering multiple aspects of diversity?
- Inclusion scores: Once hired, do diverse employees feel included and engaged?
6. Cost-per-hire
This metric can be an eye-opener. It should include:
- Direct costs: Job board fees, agency fees, relocation expenses, signing bonuses
- Indirect costs: Time spent by recruiters and hiring managers, interview expenses, and assessment tools
But don't just look at the overall number. Break it down by:
- Role: Do some positions cost more to fill than others?
- Source: Which channels give you the best bang for your buck?
- Time: Are your costs increasing or decreasing over time?
One company was shocked to find that their "cheap" method of hiring through job boards was costing them more than using a specialized recruiter. This happened when they factored in all the time their team was spending screening unqualified candidates.
7. Candidate experience score
This gauges how candidates feel about your hiring process. To measure it effectively, you need to:
- Survey candidates at multiple stages, not just at the end
- Ask about specific aspects of the process (application, interviews, communication)
- Include both successful and unsuccessful candidates
- Track trends over time
Overview of the top 23 recruiting report templates
Core Performance Reports
1. Time-to-Hire vs Time-to-Fill Report
Think of this as your complete hiring timeline diagnostic. It combines both metrics to show where delays are happening before candidates enter the pipeline or inside the hiring process.
For example, a team might see that Time-to-Fill is high, but Time-to-Hire is normal. This immediately tells them the issue isn’t interviews—it’s delays in approvals or sourcing. Fixing that early stage can significantly improve overall hiring speed.
Operationally, Time-to-Fill is primarily a workforce planning metric, while Time-to-Hire is a recruiting execution metric.
A high Time-to-Fill often points to issues such as delayed approvals, unrealistic job requirements, or weak talent pipelines. A high Time-to-Hire typically indicates bottlenecks within the hiring process itself, such as slow screening, interview delays, or slow hiring manager feedback.
Teams should use Time-to-Fill to improve hiring planning and forecasting, and Time-to-Hire to optimize recruiter and hiring manager performance.
What this report answers (decision)
- Are delays happening before hiring starts or during the process?
- Is the issue with planning (TTF) or execution (TTH)?
- What should we fix to reduce overall hiring time?
Key metrics inside it
- Time-to-Fill (job open → hire)
- Time-to-Hire (candidate entry → hire)
- Gap between TTF and TTH
- Delay classification (pre-pipeline vs pipeline)

How to read it (diagnose the problem)
- TTF much higher than TTH → Delays before candidates enter pipeline (approvals, sourcing)
- TTH close to TTF → Delays inside hiring process (interviews, feedback)
- Both high → End-to-end inefficiency
- Large variation across roles → Role-specific issues
What good looks like (benchmark)
- Most roles follow a predictable hiring timeline
- The gap between TTF and TTH remains consistent across similar roles
- Hiring managers submit feedback within agreed SLAs
- Candidates move between stages without extended idle periods
What bad looks like (red flags)
- Certain roles take significantly longer than comparable positions
- Candidate stage durations vary widely across hiring managers
- Feedback regularly misses SLA targets
- Candidates spend more time waiting than being evaluated
What to do if it’s broken (action)
- Fix pre-hiring delays → Speed up approvals, start sourcing earlier
- Fix pipeline delays → Reduce interview rounds, set feedback SLAs
- Improve planning → Align hiring timelines with demand
- Optimize roles → Adjust strategy for hard-to-fill positions
2. Source of Hire Performance Report
Think of this as your channel ROI tracker. It shows which sources (job boards, referrals, outbound, agencies, etc.) are actually bringing in quality hires.
For example, a team might see that job boards generate the most applications but very few hires, while referrals bring fewer candidates but higher-quality ones. This insight helps them shift budget and effort to what actually works.
What this report answers (decision)
- Which sources are driving the best hires?
- Where should we invest more budget and effort?
- Which channels are underperforming or wasting resources?
Key metrics inside it
- Candidates per source
- Hires per source
- Conversion rate (application → hire)
- Cost per source
- Time-to-hire (by source)
- Quality of hire (by source)
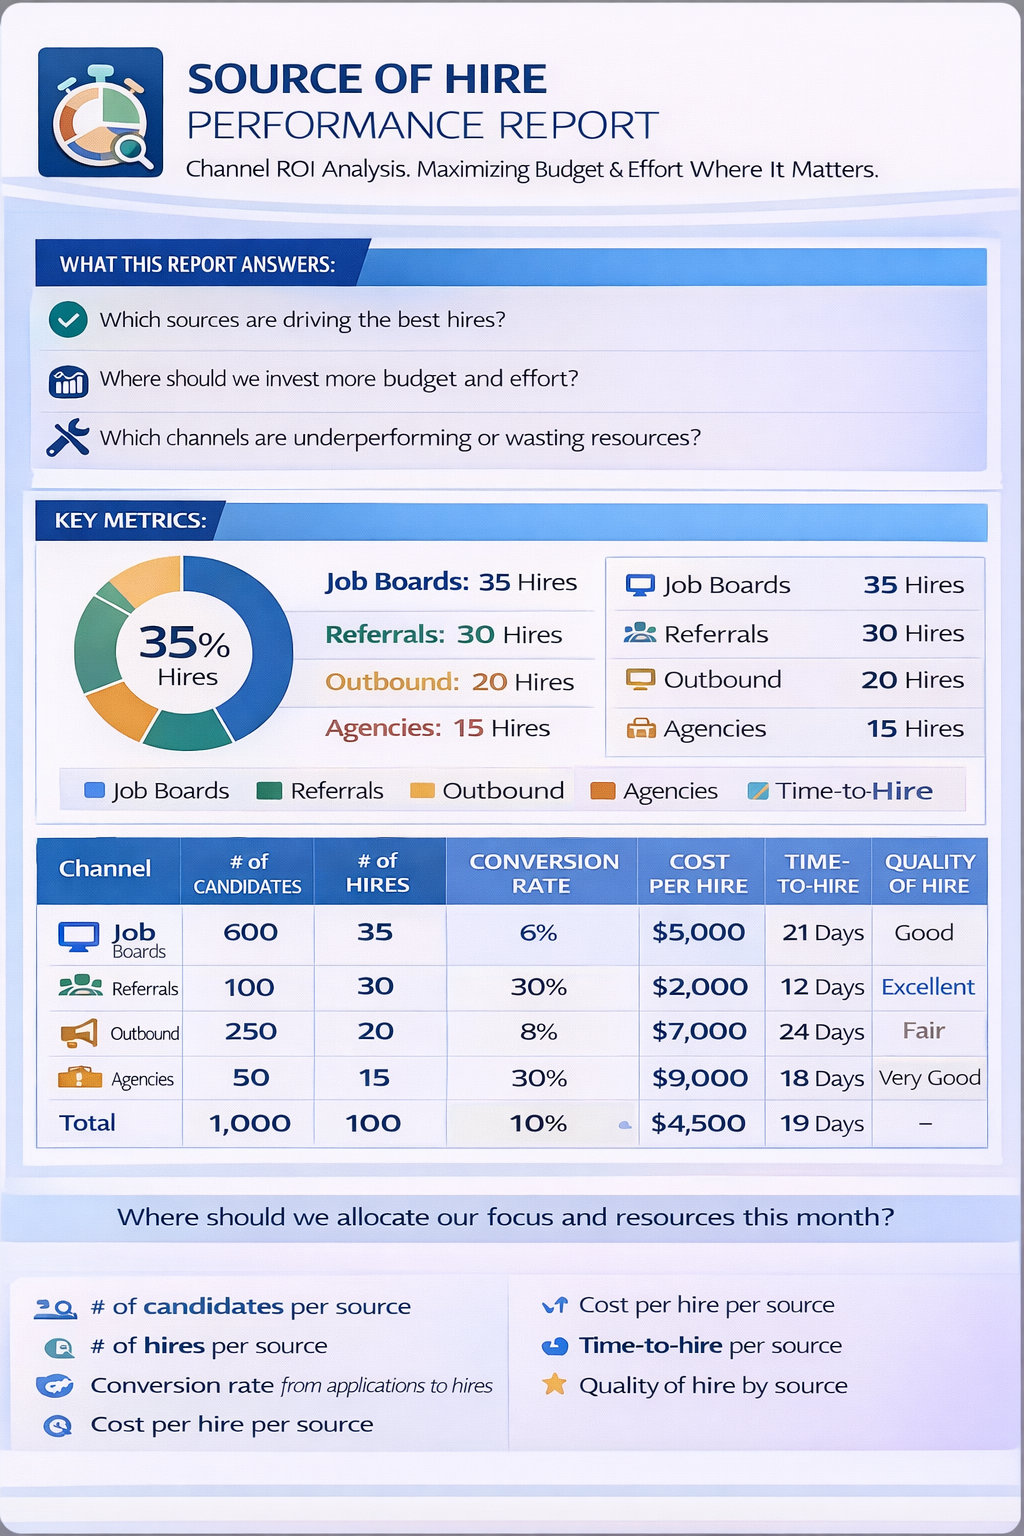
Source of Hire Performance Report Template
How to read it (diagnose the problem)
- Top-performing sources consistently outperform average conversion rates
- Referral and talent-pool channels generate a disproportionate share of hires relative to their volume
- Cost-per-hire remains stable across quarters
- No single channel contributes more than 50–60% of total hires
What good looks like (benchmark)
- High-volume channels produce applications, but few hires
- Cost-per-hire continues rising without improving hiring outcomes
- One source accounts for most hires, creating sourcing risk
- Quality-of-hire differs significantly across channels
What bad looks like (red flags)
- Heavy spend on low-performing channels
- Low conversion across most sources
- Overdependence on one source
- High time-to-hire from certain channels
What to do if it’s broken (action)
- Reallocate budget → Invest in high-converting sources
- Improve targeting → Refine sourcing criteria
- Diversify channels → Add new sourcing strategies
3. Funnel Conversion Report (with % drop-offs)
Think of this as your hiring funnel leak detector. It shows how candidates move through each stage, and more importantly, where you’re losing them and by how much (%).
What this report answers (decision)
- Where are candidates dropping off in the hiring funnel?
- Which stage is causing the biggest loss?
- What should we fix to improve conversion and hiring efficiency?
Key metrics inside it
- Candidates at each stage
- Conversion % between stages
- Drop-off % at each stage
- Stage-wise progression

How to read it (diagnose the problem)
- High drop-off % at a stage → Major leak at that stage
- Low conversion % → Poor input quality from previous stage
- Sudden funnel shrinkage → Weak sourcing or screening mismatch
- Drop-off at final stages → Offer or candidate experience issue
What good looks like (benchmark)
- No single stage accounts for the majority of candidate drop-off
- Conversion rates remain relatively consistent across similar roles
- Candidates move through stages within expected SLA timelines
- Final-stage candidate drop-off remains low
What bad looks like (red flags)
- More than half of candidate losses occur in one stage
- Conversion rates vary significantly between hiring managers
- Candidates spend more time waiting than being evaluated
- Final-round drop-offs are consistently high
What to do if it’s broken (action)
- Fix sourcing → Improve candidate quality at the top
- Fix screening → Align criteria with role requirements
- Simplify interviews → Reduce rounds, improve experience
- Improve closing → Optimize offers and communication
Execution & bottlenecks
4. Pipeline velocity report
It shows how long candidates spend in each stage, helping you identify where time is being lost, not just where candidates drop off.
For example, a team might see that candidates spend 10 days in the interview stage but only 2 days in screening. That clearly points to interview delays (scheduling, feedback, or too many rounds) as the bottleneck.
What this report answers (decision)
- Which stage is slowing down the hiring process?
- Where are candidates spending too much time?
- What should we fix to speed up hiring?
Key metrics inside it
- Average time spent in each stage
- Target vs actual time
- Stage-wise delays
- Total pipeline duration

How to read it (diagnose the problem)
- High avg time in a stage → Bottleneck at that stage
- Large gap vs target time → Process inefficiency
- Consistent delays across roles → System issue
- Role-specific delays → Hiring manager or role issue
What good looks like (benchmark)
- Candidates spend most of their time being evaluated, not waiting
- Feedback is typically submitted within 24–48 hours
- Interview scheduling happens within a few business days
- Most stages stay within predefined SLA targets
What bad looks like (red flags)
- Candidates wait longer for feedback than for interviews
- Interview scheduling regularly takes more than a week
- Stages repeatedly exceed SLA targets
- Delays compound as candidates move through the funnel
What to do if it’s broken (action)
- Fix bottlenecks → Focus on slowest stage first
- Set SLAs → Define max time per stage
- Improve coordination → Align recruiters and managers
- Simplify process → Reduce unnecessary steps
5. Stage-wise conversion report
While the funnel report shows overall drop-offs, this report focuses on how well candidates pass from one specific stage to the next.
What this report answers (decision)
- Which stage has the weakest conversion rate?
- Are we filtering too aggressively or too loosely?
- What should we fix to improve pass-through rates?
Key metrics inside it
- Candidates entering each stage
- Candidates moving to the next stage
- Conversion % (pass-through rate)
- Stage-to-stage comparison

How to read it (diagnose the problem)
- Low conversion at a stage → Problem at that specific stage
- Very high conversion → Weak filtering (low quality control)
- Drop between specific stages → Breakdown in evaluation or criteria
- Inconsistent conversion across roles → Role-specific issue
What good looks like (benchmark)
- Similar roles show similar pass-through rates
- No stage eliminates a disproportionate number of candidates
- Screening criteria remain consistent across hiring teams
What bad looks like (red flags)
- One stage removes most candidates unexpectedly
- Similar roles have dramatically different conversion patterns
- Pass-through rates fluctuate significantly month to month
What to do if it’s broken (action)
- Fix sourcing → Improve candidate quality entering pipeline
- Fix evaluation → Standardize interview criteria
- Balance filtering → Avoid over- or under-screening
- Align teams → Ensure consistent decision-making
6. Hiring manager effectiveness report
Think of this as your accountability tracker for hiring managers. It shows how each hiring manager impacts hiring speed, quality, and candidate experience.
For example, a team might notice that roles handled by one manager consistently take longer to close due to delayed feedback. Fixing that (by setting SLAs or improving alignment) can significantly reduce overall hiring time.
In many organizations, recruiters are measured closely while hiring manager performance remains largely invisible. This report brings accountability to the hiring process by showing which managers consistently provide timely feedback, move candidates through the funnel efficiently, and close roles quickly.
What this report answers (decision)
- Which hiring managers are slowing down hiring?
- Where are feedback or decision delays happening?
- What should we fix to improve hiring efficiency and consistency?
- Which hiring managers consistently create hiring bottlenecks?
Key metrics inside it
- Feedback turnaround time
- Interview-to-offer conversion rate
- Offer acceptance rate (by manager)
- Time-to-hire (by manager)
- Roles handled

How to read it (diagnose the problem)
- High feedback time → Decision delays
- Low interview → offer % → Poor evaluation or mismatch
- Low acceptance rate → Weak candidate experience or alignment
- Variation across managers → Inconsistent hiring practices
What good looks like (benchmark)
- Interview feedback submitted within agreed SLAs (e.g., 24–48 hours)
- Hiring decisions made promptly after final interviews
- Similar hiring outcomes across comparable roles
- High offer acceptance rates with minimal negotiation delays
What bad looks like (red flags)
- Feedback regularly exceeds SLA targets
- Candidates wait days or weeks for hiring decisions
- Large differences in hiring speed between managers
- Frequent offer rejections caused by slow decision-making
- The same hiring managers repeatedly appear as bottlenecks across multiple roles
What to do if it’s broken (action)
- Set SLAs → Define max feedback timelines
- Standardize interviews → Use structured evaluation criteria
- Improve alignment → Train managers on hiring expectations
- Increase accountability → Track and review manager-level performance
Team performance
7. Recruiter performance report
It shows how each recruiter contributes to hiring outcomes, helping you identify who is performing well and where support or improvement is needed.
What this report answers (decision)
- Which recruiters are driving the best hiring outcomes?
- Where is performance lagging—speed, quality, or conversion?
- What should we fix to improve recruiter effectiveness?
Key metrics inside it
- Roles closed (output)
- Time-to-hire (speed)
- Conversion rates (pipeline efficiency)
- Offer acceptance rate (closing ability)
- Pipeline volume handled

How to read it (diagnose the problem)
- Low roles closed → Low output or workload issue
- High time-to-hire → Slow execution
- Low conversion % → Poor candidate quality or screening
- Low acceptance rate → Weak closing or candidate experience
What good looks like (benchmark)
- Consistent number of roles closed
- Low and stable time-to-hire
- Strong conversion rates
- High offer acceptance rates
What bad looks like (red flags)
- One recruiter consistently underperforms team averages
- High activity but significantly lower hiring outcomes
- Large performance differences across similar workloads
- Performance declines as requisition load increases
What to do if it’s broken (action)
- Improve sourcing → Focus on better candidate quality
- Optimize process → Reduce delays and improve coordination
- Coach recruiters → Improve screening and closing skills
- Rebalance workload → Align roles with recruiter capacity
8. Activity vs output report
Think of this as your effort vs results reality check. It compares what recruiters are doing (calls, emails, screens) vs what they’re actually achieving (interviews, offers, hires).
What this report answers (decision)
- Are recruiter activities translating into real hiring outcomes?
- Who is efficient vs who is just busy?
- What should we fix—effort, quality, or process?
Key metrics inside it
- Activity metrics (calls, emails, screens)
- Output metrics (interviews, offers, hires)
- Conversion rates (activity → outcome)
- Activity-to-hire ratio

How to read it (diagnose the problem)
- High activity + low hires → Poor quality sourcing or screening
- Low activity + high hires → Efficient, high-quality work
- High screens but low interviews → Weak candidate quality
- High interviews but low hires → Poor evaluation or mismatch
What good looks like (benchmark)
- Output grows alongside activity
- Strong conversion from activity → hire
- Recruiters achieve similar outcomes without excessive activity
What bad looks like (red flags)
- Recruiters rely significantly more on outreach than their peers to achieve the same results
- High screening volume produces few qualified candidates
- Team success depends on effort rather than process efficiency
What to do if it’s broken (action)
- Improve quality → Focus on better sourcing and targeting
- Refine screening → Filter candidates more effectively
- Optimize effort → Prioritize high-impact activities
- Coach recruiters → Improve efficiency and decision-making
Financial metric
9. Cost per hire
Think of this as your true hiring cost tracker. It shows how much you’re spending to hire each candidate, but more importantly, it reveals whether that spend is efficient or silently draining your budget.
Most teams only calculate obvious costs like job boards or agency fees. But the real impact comes from hidden (soft) costs, which are often much higher and completely ignored.
For example, a role staying open for 60 days doesn’t just increase hiring cost, it leads to lost productivity, delayed projects, and revenue impact. That’s where the real cost lies.
What this report answers (decision)
- How much does it actually cost us to hire one candidate?
- Are we spending efficiently across sources and roles?
- Where are hidden costs increasing our hiring budget?
Key metrics inside it
- Direct costs (ads, agencies, tools)
- Soft costs (critical):
- Recruiter time spent
- Hiring manager time
- Lost productivity (vacant role impact)
- Cost of losing candidates to competitors
- Total cost per hire
- Cost by source/role

How to read it (diagnose the problem)
- High total cost per hire → Inefficient hiring process
- High soft cost vs direct cost → Delays are driving cost
- High cost from specific roles → Hard-to-fill or poorly planned roles
- High cost from specific sources → Low ROI channels
What good looks like (benchmark)
- Cost per hire remains stable as hiring volume grows
- Soft costs represent a manageable share of total hiring costs
- High-cost roles deliver proportionately higher business value
- Spending is concentrated on channels with proven hiring outcomes
What bad looks like (red flags)
- Rising cost per hire
- High soft costs (often hidden)
- Long vacancy periods
- High spend with low hiring output
What to do if it’s broken (action)
- Reduce delays → Speed up hiring to cut soft costs
- Optimize sources → Invest in high-ROI channels
- Improve planning → Reduce vacancy duration
- Track full cost → Include both direct and soft costs
Advanced Recruiting Reports
10. Forecasting / hiring demand report
Instead of showing what already happened, this report uses historical data and trends to predict what hiring will look like ahead.
For example, a team might notice that attrition spikes every Q2 and engineering roles take 60+ days to fill. With forecasting, they can start hiring before the demand hits, instead of reacting too late.
What this report answers (decision)
- How many hires will we need in the coming months?
- Which roles will be hardest or slowest to fill?
- Where will hiring gaps or risks occur?
Key metrics inside it
- Historical hiring trends
- Attrition/flight risk data
- Projected hiring demand
- Time-to-fill (by role)
- Hiring gap (demand vs current pipeline)

How to read it (diagnose the problem)
- High projected demand + long time-to-fill → Future hiring risk
- High attrition rate → Workforce instability
- Late hiring start vs need date → Planning gap
- Mismatch between demand and pipeline → Future hiring shortfall
What good looks like (benchmark)
- Hiring plans are created before requisitions become urgent
- Future hiring demand is visible several months in advance
- Critical roles have active pipelines before openings occur
- Hiring forecasts closely align with actual hiring needs
What bad looks like (red flags)
- Reactive hiring (roles opened too late)
- Repeated hiring shortages
- High attrition without replacement planning
- Constant urgency in hiring
What to do if it’s broken (action)
- Use historical data → Identify hiring patterns and trends
- Plan ahead → Start hiring before demand peaks
- Align with business → Sync hiring plans with growth targets
- Build pipeline early → Reduce dependency on urgent hiring
11. High-volume hiring throughput report
Think of this as your hiring capacity and speed-at-scale tracker. It measures how efficiently your team can process large volumes of candidates, especially for bulk or hourly roles.
For example, a team hiring 200 customer support agents might realize they receive 2,000 applications but only screen 100 per day. That creates a backlog and leads to candidate drop-offs.
What this report answers (decision)
- Can we handle high-volume hiring demand efficiently?
- Where are bottlenecks when processing large candidate volumes?
- What should we fix to increase hiring speed at scale?
Key metrics inside it
- Total applicants (volume)
- Candidates processed per day (throughput)
- Conversion % at scale
- Automation vs manual processing (%)
- Backlog/delay per stage

High-volume hiring throughput report template
How to read it (diagnose the problem)
- High volume + low processing rate → Throughput bottleneck
- Large backlog at a stage → Capacity issue
- Low automation % → Over-reliance on manual work
- Drop-offs at scale → Candidate experience breakdown
What good looks like (benchmark)
- Candidate backlogs are cleared within a few business days
- Screening capacity keeps pace with application volume
- Most repetitive tasks are automated
- Conversion rates remain stable even during hiring spikes
What bad looks like (red flags)
- Large backlog of candidates
- Slow screening or interview capacity
- High manual workload
- Drop-offs due to delays
What to do if it’s broken (action)
- Increase throughput → Improve processing capacity per stage
- Add automation → Use tools for screening/scheduling
- Reduce bottlenecks → Optimize slow stages
- Improve experience → Speed up candidate communication
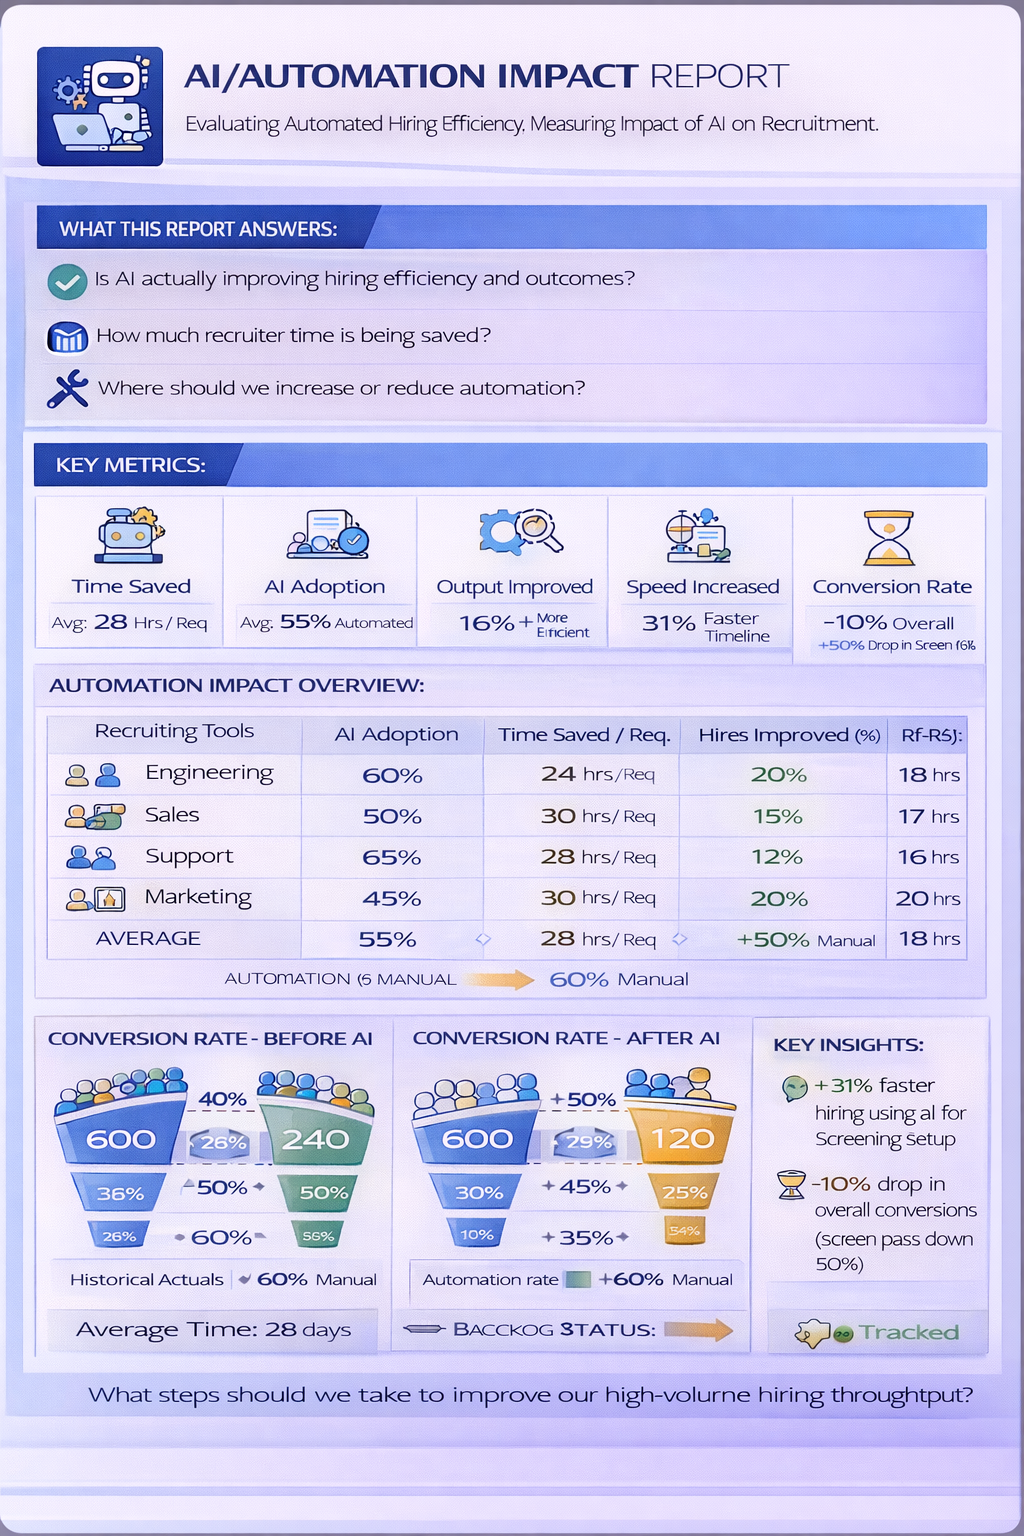
12. AI/automation impact report
It shows whether your automation tools are actually improving hiring or just adding another layer of tech.
For example, a team might introduce automated screening and assume it’s working. But this report might reveal that while screening time dropped by 40%, conversion also dropped.
What this report answers (decision)
- Is AI actually improving hiring efficiency and outcomes?
- How much recruiter time is being saved?
- Where should we increase or reduce automation?
Key metrics inside it
- Time saved (hours reduced)
- AI adoption rate (per role/requisition)
- Output improvement (hires, speed)
- Conversion rates (before vs after AI)
- Bias indicators (if tracked)
How to read it (diagnose the problem)
- High time saved + stable conversion → Effective automation
- High time saved + low conversion → Quality issue
- Low adoption % → Underutilized AI tools
- No measurable impact → AI not adding value
What good looks like (benchmark)
- Time savings are accompanied by stable or improved conversion rates
- Recruiters spend less time on administrative work
- AI adoption increases across teams
- Automation improves speed without reducing hiring quality
What bad looks like (red flags)
- High automation but declining quality
- Low adoption despite available tools
- No clear improvement in outcomes
- Over-reliance on manual work
What to do if it’s broken (action)
- Optimize usage → Apply AI where it adds value
- Train teams → Increase adoption and correct usage
- Balance automation → Keep human checkpoints
- Measure impact → Continuously compare before vs after
Strategic & Performance Reports (Big-picture decision-making)
13. Human resource recruiting report with monthly metrics template
This is your go-to for a comprehensive overview of recruiting activities. It's like a monthly health check for your hiring process.
What this report answers (decision)
- Are we hiring efficiently?
- Where are we losing time, money, or candidates?
- What should we fix this month?
Key metrics inside it
- Time-to-hire vs time-to-fill
- Offer acceptance rate
- Cost-per-hire
- Source of hire
- Funnel conversion %

How to read it (diagnose the problem)
- Time-to-Fill > Time-to-Hire → Delays are happening before candidates enter the pipeline (approvals, sourcing gaps)
- Low offer acceptance rate → Candidates are dropping at the final stage
- Low funnel conversion % → Candidates are dropping early or mid-funnel
- High cost-per-hire + weak sources → Budget is not translating into quality hires
What good looks like (benchmark)
- Time-to-hire is stable or improving
- Offer acceptance rate is above 85%
- Funnel conversion rates are consistent across roles
- Top sources repeatedly drive hires
What bad looks like (red flags)
- Time-to-fill keeps increasing
- Offer acceptance drops below 60–70%
- High spend on channels that don’t convert
- Conversion rates fluctuate heavily
What to do if it’s broken (action)
- Fix delays → Set SLAs, streamline approvals, start sourcing earlier
- Improve acceptance → Adjust comp, speed up offers, improve experience
- Improve conversion → Tighten screening, refine sourcing channels
- Reduce costs → Double down on high-performing sources, cut low ROI spend
14. Agency recruiting annual report template
This is a prominent one, your yearly in-depth analysis. It covers everything from positions filled to the quality of candidates sourced, cost per hire, and time-to-fill data. It's essential to assess your overall recruiting performance and plan for the year ahead.
What this report answers (decision)
- Did we meet our hiring goals this year?
- Which strategies, sources, and roles performed best?
- Where should we invest or change strategy next year?
Key metrics inside it
- Total hires vs hiring targets
- Time-to-fill (yearly average)
- Cost-per-hire (overall + by role)
- Source of hire performance
- Quality of hire (retention/performance)

How to read it (diagnose the problem)
- Hires < target → Hiring goals not met
- High time-to-fill across roles → Process inefficiency
- High cost-per-hire → Budget inefficiency
- Low retention/quality → Poor hiring decisions
What good looks like (benchmark)
- Hiring targets consistently met
- Stable or improving time-to-fill
- Optimized cost-per-hire
- High retention and performance of hires
What bad looks like (red flags)
- Consistent gap between hires and targets
- Increasing time-to-fill year-over-year
- Rising hiring costs without better outcomes
- Low retention of new hires
What to do if it’s broken (action)
- Improve planning → Set realistic hiring forecasts
- Fix process → Optimize stages and reduce delays
- Optimize budget → Invest in high-performing sources
- Improve quality → Refine screening and evaluation criteria
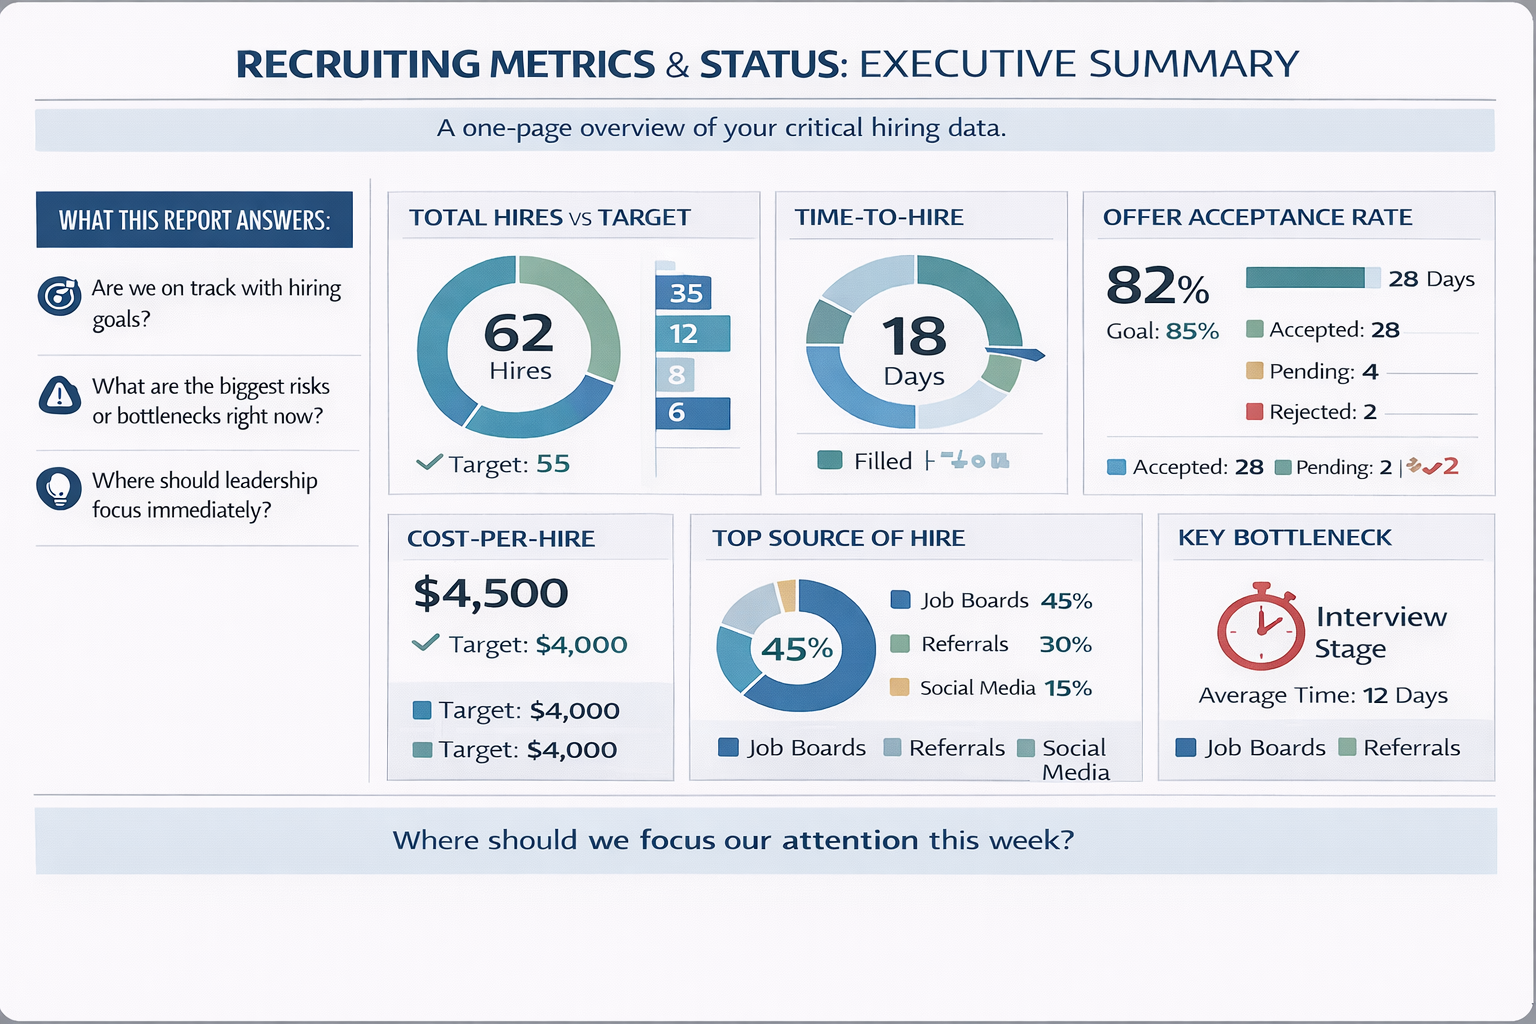
15. One-page recruiting metrics and status report template
This is your executive summary. It condenses all your critical hiring data into a single, easy-to-digest page. It's a godsend for communicating with stakeholders and making quick, informed decisions when you need to look at key info at a glance.
You can use this in board meetings. It cuts through the noise and focuses on the metrics that really matter for strategic decision-making.
What this report answers (decision)
- Are we on track with hiring goals?
- What are the biggest risks or bottlenecks right now?
- Where should leadership focus immediately?
Key metrics inside it
- Total hires vs target
- Time-to-hire
- Offer acceptance rate
- Cost-per-hire
- Top source of hire
- Key bottleneck (stage or role)
How to read it (diagnose the problem)
- Status indicators (⚠️/❌) → Highlight what needs attention
- Gaps vs target → Show where performance is off-track
- Key insight column → Explains the issue behind the metric
What good looks like (benchmark)
- Leadership can identify the top hiring risk within minutes
- Metrics tell a consistent story
- Key bottlenecks are clearly visible
- Corrective actions are obvious
What bad looks like (red flags)
- Multiple metrics below the target
- Repeated risk indicators across key areas
- Conflicting signals (e.g., fast hiring but low quality)
- Lack of clarity on issues
What to do if it’s broken (action)
- Prioritize issues → Focus on 1–2 critical metrics
- Align teams → Communicate clear hiring priorities
- Adjust strategy → Fix bottlenecks or reallocate resources
- Simplify reporting → Keep only high-impact metrics
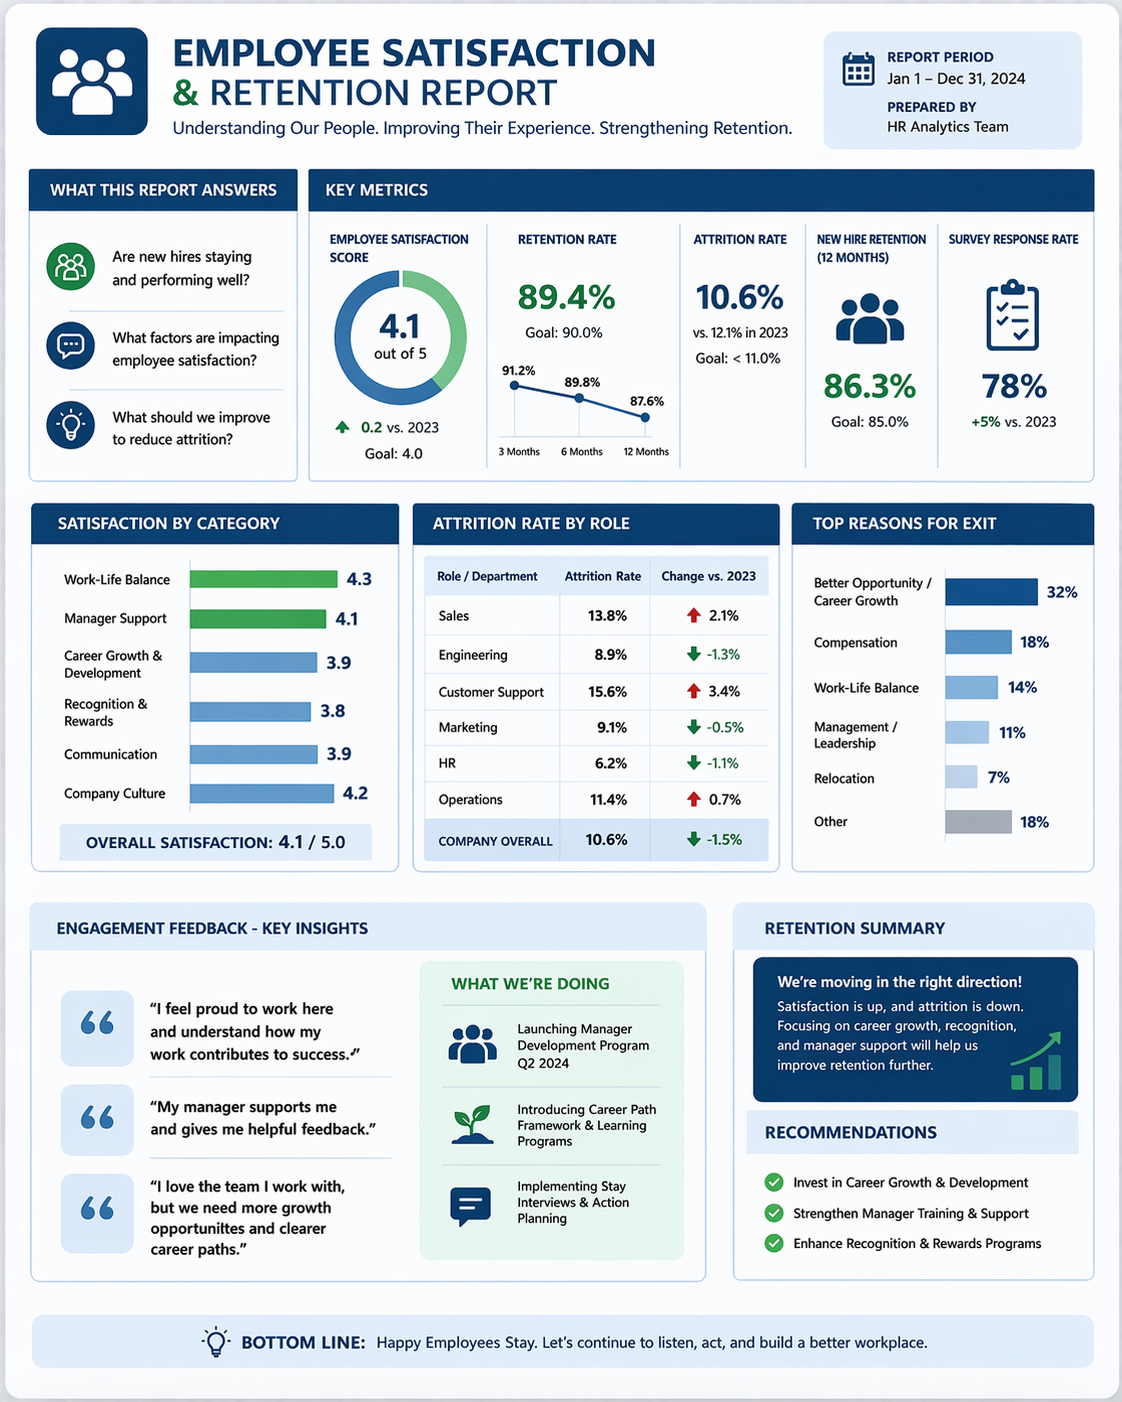
16. Employee satisfaction and retention report
This one helps you understand your organization's pulse and retain the people you already have.
It consolidates survey findings to help you track engagement levels. It's key to improving retention and creating a better employee experience.
What this report answers (decision)
- Are new hires staying and performing well?
- What factors are impacting employee satisfaction?
- What should we improve to reduce attrition?
Key metrics inside it
- Employee satisfaction score
- Retention rate (3/6/12 months)
- Attrition rate (by role/team)
- Top reasons for exit
- Engagement feedback (survey insights)
How to read it (diagnose the problem)
- Low satisfaction score → Poor employee experience
- Low retention / high attrition → Employees are leaving early
- Common issues across roles → Systemic organizational problem
- Role-specific issues → Team or function-level problem
What good looks like (benchmark)
- Satisfaction scores trend upward over time
- 3-, 6-, and 12-month retention remains stable
- New-hire retention aligns with company averages
- Exit reasons are identifiable and actionable
What bad looks like (red flags)
- Low satisfaction scores (<7)
- High early attrition (first 6 months)
- Repeated complaints across teams
- No clear pattern in feedback
What to do if it’s broken (action)
- Improve onboarding → Set clear expectations and support early-stage hires
- Fix key issues → Address compensation, workload, or management gaps
- Act on feedback → Turn survey insights into visible changes
- Monitor regularly → Use pulse surveys to track improvements
17. Competitor Hiring Intelligence Report
This report helps you understand how competing employers are attracting talent and where your hiring strategy may be falling behind.
What this report answers (decision)
- Which competitors are hiring for similar roles?
- Are our salary ranges and benefits competitive?
- How does our employer value proposition compare?
- What hiring trends could impact our ability to attract talent?
Key metrics inside it
- Competitor job posting volume
- Salary range comparisons
- Benefits and perks analysis
- Hiring locations and remote-work policies
- Employer branding and job messaging trends
- Time-to-fill signals (where available)

How to read it (diagnose the problem)
- Competitors hiring aggressively for the same roles → Increased talent competition
- Higher salary ranges → Compensation gap
- Stronger benefits or flexibility → EVP disadvantage
- Faster expansion into new markets → Emerging talent shortage risk
What good looks like (benchmark)
- Competitive salary and benefits positioning
- Clear employer differentiation
- Stable hiring competitiveness in target roles
- Awareness of emerging market trends
What bad looks like (red flags)
- Competitors consistently offering higher compensation
- Similar candidates choosing competitors
- Outdated employer branding or messaging
- Frequent offer declines due to compensation or benefits
What to do if it's broken (action)
- Review compensation and benefits strategy
- Strengthen employer branding and job messaging
- Adjust hiring plans based on market demand
- Build talent pipelines before competition intensifies
Operational & Pipeline Reports
18. Monthly recruiting process report of job positions template
This one tracks job openings across different roles. It helps you pinpoint bottlenecks, refine your sourcing strategies, and boost recruiting efficiency. It's a lifesaver for keeping your hiring on track.
What this report answers (decision)
- Which roles are hardest to fill?
- Where is hiring getting stuck for each role?
- Which roles need immediate attention or more resources?
Key metrics inside it
- Open roles vs hires
- Time-to-fill (by role)
- Candidates in pipeline (per role)
- Stage with a delay
- Source of hire (by role)

How to read it (diagnose the problem)
- High time-to-fill for a role → That role is difficult to close
- Low pipeline size → Not enough candidates for that role
- Same delay stage across roles → System/process issue
- Different delay stages per role → Role-specific issue
What good looks like (benchmark)
- Roles are filled within expected timelines
- Each role has a healthy pipeline
- Delays are minimal and predictable
- Reliable sources for each role
What bad looks like (red flags)
- Certain roles consistently take longer to fill
- Very low candidate pipeline for key roles
- Frequent delays at critical stages
- Overdependence on ineffective sources
What to do if it’s broken (action)
- Fix hard roles → Adjust job requirements, widen talent pool
- Improve pipeline → Increase sourcing efforts or try new channels
- Fix delays → Set stage-wise SLAs, align hiring managers
- Optimize sources → Shift to channels that work for that specific role
19. Recruiting analytics report summary with workflow status template
Think of this as your recruiting pipeline dashboard. It gives you real-time insights into where candidates are in the process, helping you identify gaps and areas for improvement. It's crucial for optimizing your hiring workflow.
Say you’re a tech startup that used this and realized your technical interviews were causing a major slowdown. You can implement a more efficient coding challenge and double pipeline speed.
What this report answers (decision)
- Where are candidates getting stuck in the hiring process?
- Which stages are slowing down the pipeline?
- What should we fix to improve hiring speed?

Key metrics inside it
- Candidates per stage
- Stage-wise conversion %
- Drop-off % per stage
- Average time in each stage
- Total pipeline volume
How to read it (diagnose the problem)
- High drop-off at a stage → Candidates are being filtered out or losing interest there
- High time in a stage → Process delay or dependency (e.g., interview scheduling)
- Low conversion between stages → Poor quality input from the previous stage
- Sudden pipeline shrinkage → Weak sourcing or early-stage filtering
What good looks like (benchmark)
- Smooth, gradual drop-offs across stages
- Stable conversion rates between stages
- Low average time per stage
- No single stage acts as a bottleneck
What bad looks like (red flags)
- Sharp drop-offs at specific stages
- High time spent in one stage (e.g., interviews)
- Large gaps between stages
- Inconsistent or unpredictable conversion rates
What to do if it’s broken (action)
- Fix drop-offs → Improve sourcing quality or screening criteria
- Reduce delays → Streamline scheduling, set stage SLAs
- Improve conversion → Simplify interview process, align evaluation
- Stabilize pipeline → Increase top-of-funnel input
20. Weekly recruiting report with candidate status template
This is your weekly pulse check. It shows you the status of candidates in your pipeline, the interview stages, and offer acceptance rates. It's perfect for keeping your team aligned and making quick adjustments to your hiring tactics.
It keeps everyone accountable and helps catch issues before they become problems.
What this report answers (decision)
- Which candidates are at risk of delay or drop-off this week?
- Are we meeting expected timelines at each stage?
- What needs immediate action to keep hiring on track?
Key metrics inside it
- Candidate status by stage
- Days spent in the current stage
- Target time per stage (SLA)
- Next action + owner
- Weekly movement (progress vs stuck)

How to read it (diagnose the problem)
- Days > target days → Delay at that stage
- No next step defined → Ownership gap
- Multiple delayed candidates in the same stage → Process bottleneck
- Pending with the hiring manager → Feedback delay issue
What good looks like (benchmark)
- Most candidates remain within SLA targets
- Every candidate has a defined next step and owner
- Delayed candidates are identified and escalated weekly
- Few candidates remain inactive for more than a few days
What bad looks like (red flags)
- Candidates exceeding stage timelines
- Missing next steps or unclear ownership
- Repeated delays in the same stage
- Candidates stuck for multiple days
What to do if it’s broken (action)
- Set SLAs → Define clear time limits for each stage
- Assign ownership → Ensure every candidate has a next step owner
- Fix bottlenecks → Focus on stages with repeated delays
- Review weekly → Use this report to drive weekly hiring actions
Compliance, Audit & Employer Branding Reports
21. Recruiting Agency Business Development Performance Report
For staffing and recruiting agencies, hiring outcomes depend on a healthy client pipeline. This report tracks business development activities and identifies whether outreach efforts are generating qualified meetings, opportunities, and new clients.
What this report answers (decision)
- Are our BD activities generating enough client opportunities?
- Which outreach channels perform best?
- Where are prospects dropping off in the sales funnel?
- What should we improve to win more recruiting business?
Key metrics inside it
- Outbound emails sent
- Calls made
- LinkedIn outreach volume
- Email reply rate
- Call-to-meeting conversion rate
- Meeting-to-opportunity conversion rate
- Opportunity-to-client conversion rate
- Revenue generated by BD efforts

How to read it (diagnose the problem)
- High outreach + low replies → Weak targeting or messaging
- High replies + low meetings → Poor qualification process
- High meetings + low opportunities → Weak discovery calls
- High opportunities + low wins → Positioning or pricing issue
What good looks like (benchmark)
- Consistent meeting generation from outreach
- Healthy conversion between funnel stages
- Multiple channels generating opportunities
- Predictable pipeline growth month-over-month
What bad looks like (red flags)
- High outreach activity but few meetings
- Dependence on a single acquisition channel
- Large drop-offs between meetings and opportunities
- Unpredictable BD pipeline
What to do if it's broken (action)
- Improve targeting and prospect lists
- Refine outreach messaging
- Strengthen discovery and qualification process
- Diversify lead generation channels
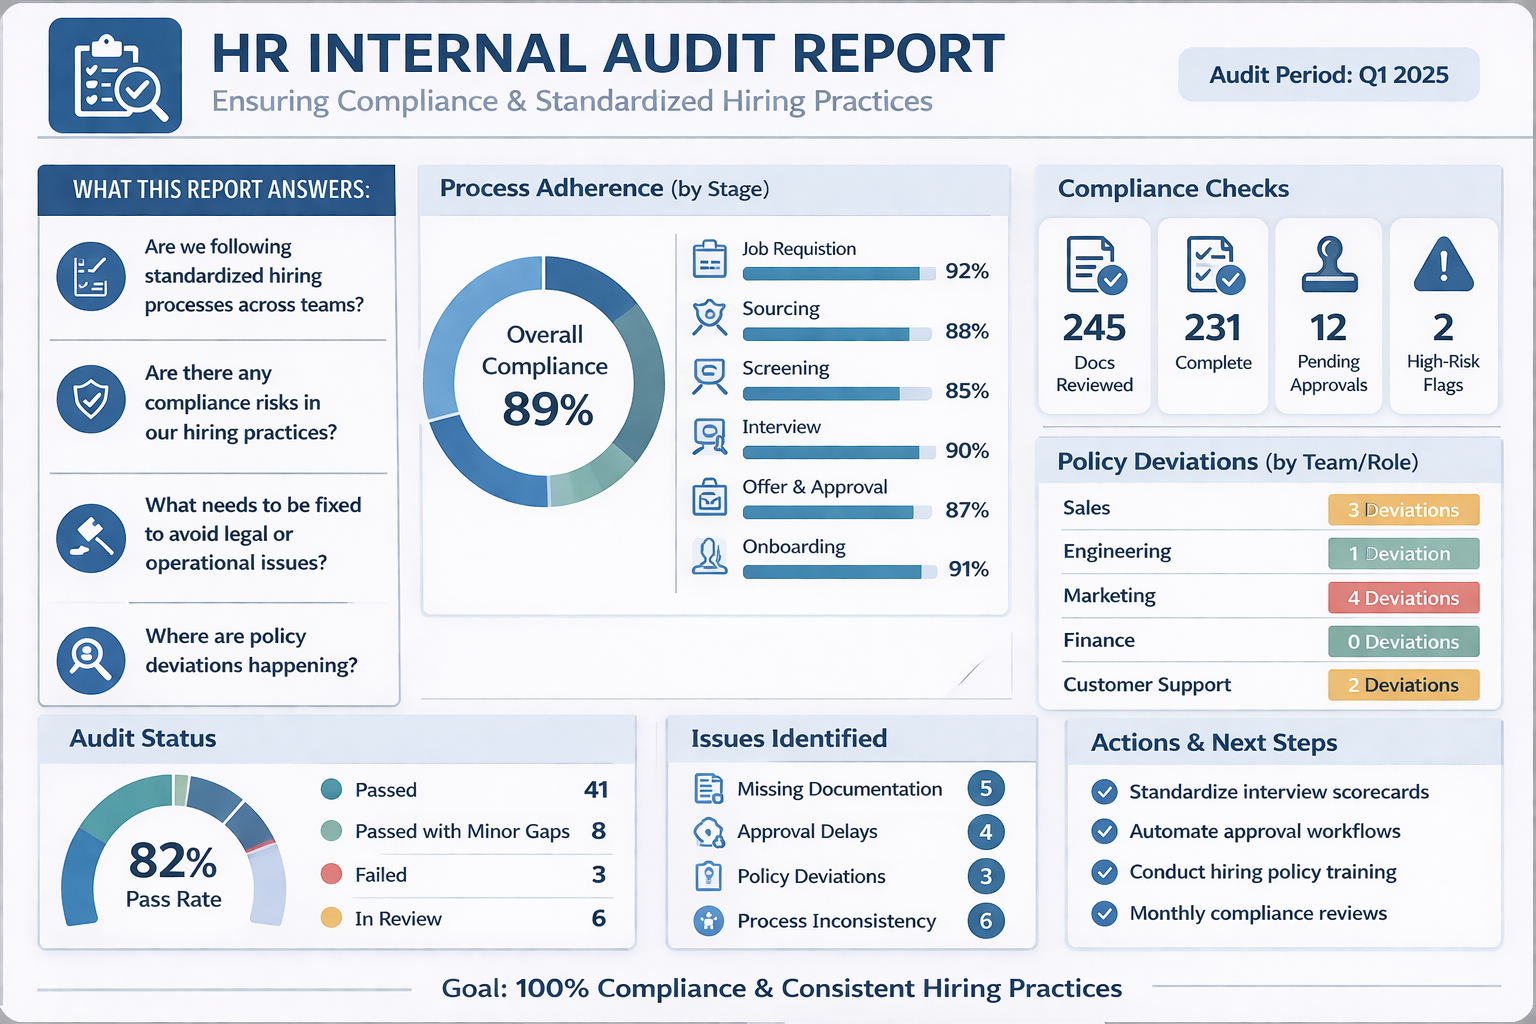
22. HR internal audit report
This template is a lifesaver when it comes to staying on top of compliance and best practices. It's not the most exciting report, but it's crucial for mitigating risks.
You can use this to uncover inconsistencies in your hiring practices across different departments. With a template like this one, you can standardize processes and avoid potential legal issues down the line. It's the kind of report that doesn't get much attention until it saves your bacon.
What this report answers (decision)
- Are we following standardized hiring processes across teams?
- Are there any compliance risks in our hiring practices?
- What needs to be fixed to avoid legal or operational issues?
Key metrics inside it
- Process adherence (by stage)
- Compliance checks (documentation, approvals)
- Policy deviations (by team/role)
- Audit status (pass/fail)
- Issues identified
How to read it (diagnose the problem)
- Repeated failures at a stage → Process breakdown
- Multiple issues across teams → Lack of standardization
- Missing documentation → Compliance risk
- Unassigned issues → Ownership gaps
What good looks like (benchmark)
- Most checkpoints marked as “Pass”
- Minimal deviations across teams
- Clear documentation at every stage
- Issues resolved quickly
What bad looks like (red flags)
- Frequent failures in critical stages
- Inconsistent practices across teams
- Missing approvals or documentation
- Repeated unresolved issues
What to do if it’s broken (action)
- Standardize processes → Define clear hiring workflows
- Improve compliance → Add mandatory checkpoints and documentation
- Assign ownership → Ensure every stage has clear responsibility
- Audit regularly → Run quarterly reviews and fix recurring issues
23. HR roles and responsibility report
This template is fantastic for clarifying who does what within your HR team. It might seem basic, but you'd be surprised how often roles get muddy, especially in growing organizations.
With this, you can identify skill gaps and improve overall team efficiency. It's also great for onboarding new team members.
What this report answers (decision)
- Who is responsible for each stage of hiring?
- Where are ownership gaps or overlaps?
- What needs to be clarified to improve team efficiency?
Key metrics inside it
- Role (team member)
- Responsibility (by hiring stage)
- Ownership level (primary/secondary)
- Current workload
- Skill gaps (if any)

How to read it (diagnose the problem)
- Unassigned stages → Ownership gap
- Multiple owners for same task → Overlap or confusion
- High workload for individuals → Resource imbalance
- Skill gaps flagged → Capability issue
What good looks like (benchmark)
- Every hiring stage has a clearly accountable owner
- Workload is distributed realistically across the team
- Decision-making authority is clear
- New team members can easily understand responsibilities
What bad looks like (red flags)
- Missing ownership for key stages
- Multiple people handling the same task
- Overloaded or underutilized team members
- Undefined or unclear responsibilities
What to do if it’s broken (action)
- Assign ownership → Define clear responsibility per stage
- Reduce overlap → Streamline roles and eliminate duplication
- Balance workload → Redistribute tasks across team
- Close gaps → Train team or hire for missing skills
Why should you use recruiting report templates?
1. Simplified reporting methods
With recruiting report templates, you do not need to start from scratch whenever you want to give an update about your recruiting efforts, with a well-designed process in place. You may need to fill in the data, but you still save time that can be spent with potential candidates and their respective hiring managers.
These templates also provide uniformity in reporting. It becomes easier to compare results across departments over time when everyone is on the same page.
However, what about communication?
Instead of trying to explain complex hiring data in an email, you’ve got a clear, visually appealing report that tells the story at a glance. Raw data can overwhelm even the most seasoned hiring managers. But present them with a well-structured report template, and their eyes light up with understanding and insight.
2. Improved accuracy and insights from data
Now, this is where things get really interesting.
Because you’ve systemized the whole process and reduced manual entry, you’re likely to make fewer errors. This is further reduced with a modern ATS platform that removes manual entry completely by allowing you to import data directly.
Templates encourage you to take a systematic approach toward information gathering, too.
Let’s consider a company whose attention was completely focused on time-to-hire. When they started using a source effectiveness template, they discovered that their quickest hires had the lowest performance rating.
This is one revelation that was just as shocking as it sounds. They could have never paired both metrics without a template that forced them to.
3. Improved decision-making capacity
Let’s take a pipeline report, for example. It does not merely indicate how many candidates are at every stage. What it does is identify bottlenecks and predict hiring based on conversion rates recorded previously. You can then plan for it rather than reacting to it.
From your source effectiveness reports, you may notice that employee referrals were consistently outperforming other channels. This can give you the green light to reinvest in their referral program by raising bonuses given per referral made. The outcome? Increased quality hires within the next quarter.
4. Better tracking of recruiting measures
What gets measured gets managed. Templates make sure that you are consistently keeping track of metrics that matter the most to your organization.
It isn’t just about tracking more but tracking better. A well-designed template will drive your focus toward KPIs that correlate with business outcomes.
For example, it isn’t just how many people are hired, what also matters is their performance at 3, 6, and 12 months post-hire.
When monitoring consistent data over time, you start seeing patterns, come up with realistic targets, and compare them to benchmarks. Companies can change their hiring performance by understanding what good vs. great looks like in terms of industry and size.
5. Easier compliance and audit processes
Depending on your industry or location, you may need to meet some rigorous reporting expectations.
Rather than being caught off-guard trying to gather data from different sources all at once, use templates to bring everything together. Because you have been consistently using these templates, trends become easy to identify—something auditors adore.
However, meeting the auditor’s expectations isn’t the purpose of using templates. They allow you to identify potential areas of non-compliance well in advance.
Take our diversity and inclusion dashboard, for example. It doesn’t just present current demographics but tracks variations over time.
You may think you’re doing great when it comes to gender diversity because the company has good overall figures for that metric. However, disaggregated by department using a DEI template, you may find that women are seriously underrepresented in technical roles.
Why spreadsheets and manual reporting break at scale
Spreadsheets might work early on, but they quickly become a bottleneck as hiring grows.
Data gets fragmented across tools, forcing recruiters to manually compile reports, often leading to errors and blind spots.
By the time reports are ready, insights are already outdated, making it hard to act on real-time pipeline issues.
This delays decisions and costs you, top candidates. On top of that, recruiters spend more time updating data than actually hiring.
Recruiting report templates go beyond mere organization; they have the power to revolutionize your entire hiring process.
These templates provide invaluable insights that empower you to consistently make better hiring decisions.
But why stop there?
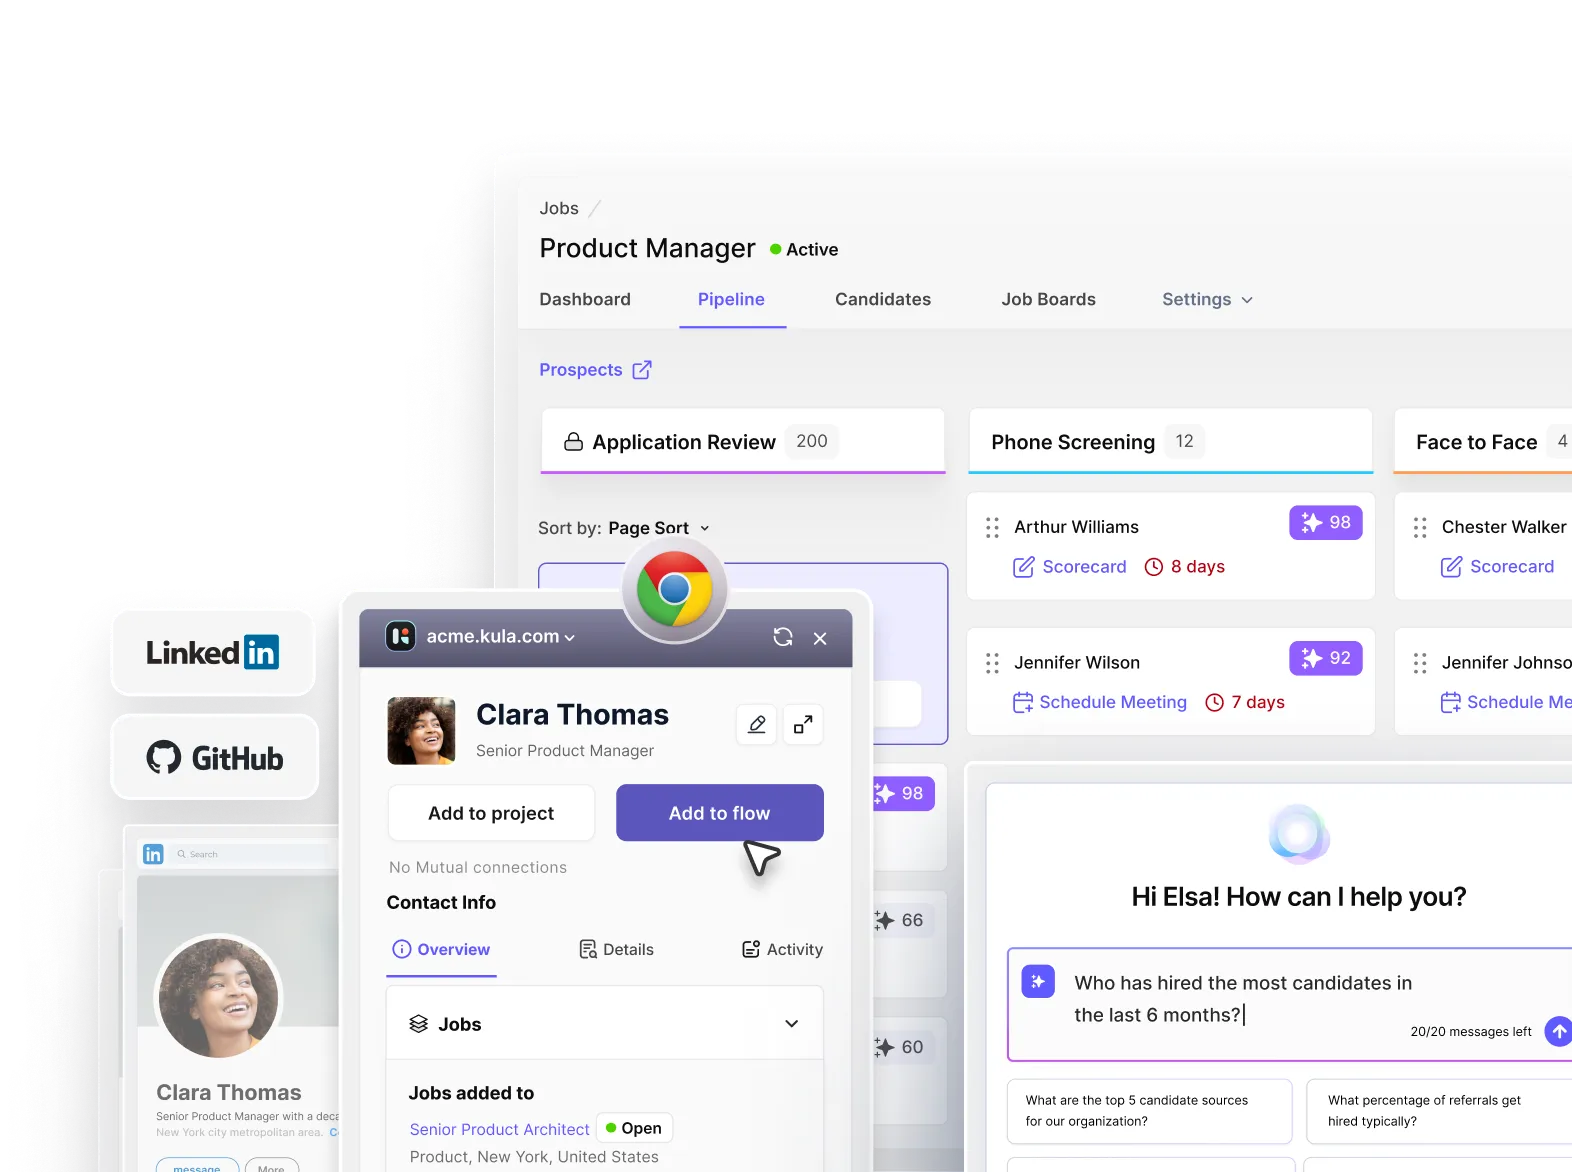
This is exactly where tools like Kula come in.
Instead of stitching data together manually, a well-built ATS:
- Centralizes all hiring data in one place
- Provides 100+ ready-to-use insights instantly
- Enables real-time dashboards and reporting
- Allows you ask questions and get answers instantly with conversational AI
You can simply bypass the grunt work and manual data entry by upgrading your ATS, where everything is automated from scratch.
To see for yourself, schedule a demo now!
Metrics can transform hiring processes from guesswork to a data-driven machine. Time-to-hire metrics can pinpoint exactly where candidates are getting stuck. Source effectiveness metrics show you which channels are bringing in the best talent, helping you allocate your budget more effectively. And quality of hire metrics, while tricky to measure, provide invaluable insights into the long-term success of your hiring decisions.
Absolutely! Customization is crucial. Every company has unique hiring challenges, and their reporting needs to reflect that. Start with the standard template, then tweak it as you go. You'll quickly see which metrics matter most for your organization.
In my experience, a tiered approach works best: Daily or weekly for quick snapshots like pipeline reports. These keep you nimble and able to react quickly. Monthly for more comprehensive stuff like source effectiveness or cost-per-hire. This gives you enough data to spot trends without getting bogged down in day-to-day fluctuations. Quarterly for in-depth metrics like quality of hire or diversity and inclusion. These often need a longer time frame to show meaningful results. Annually for big-picture metrics like overall recruiting ROI or year-over-year comparisons. So, the key is consistency. Pick a schedule and stick to it. This will allow you to make accurate comparisons over time and spot long-term trends. AI native ATS has built-in features to automate much of this reporting. You can set up dashboards that update in real time and schedule regular reports to be sent to key stakeholders. The goal is to get everyone the info they need, when they need it, without creating extra work for your recruiting team.