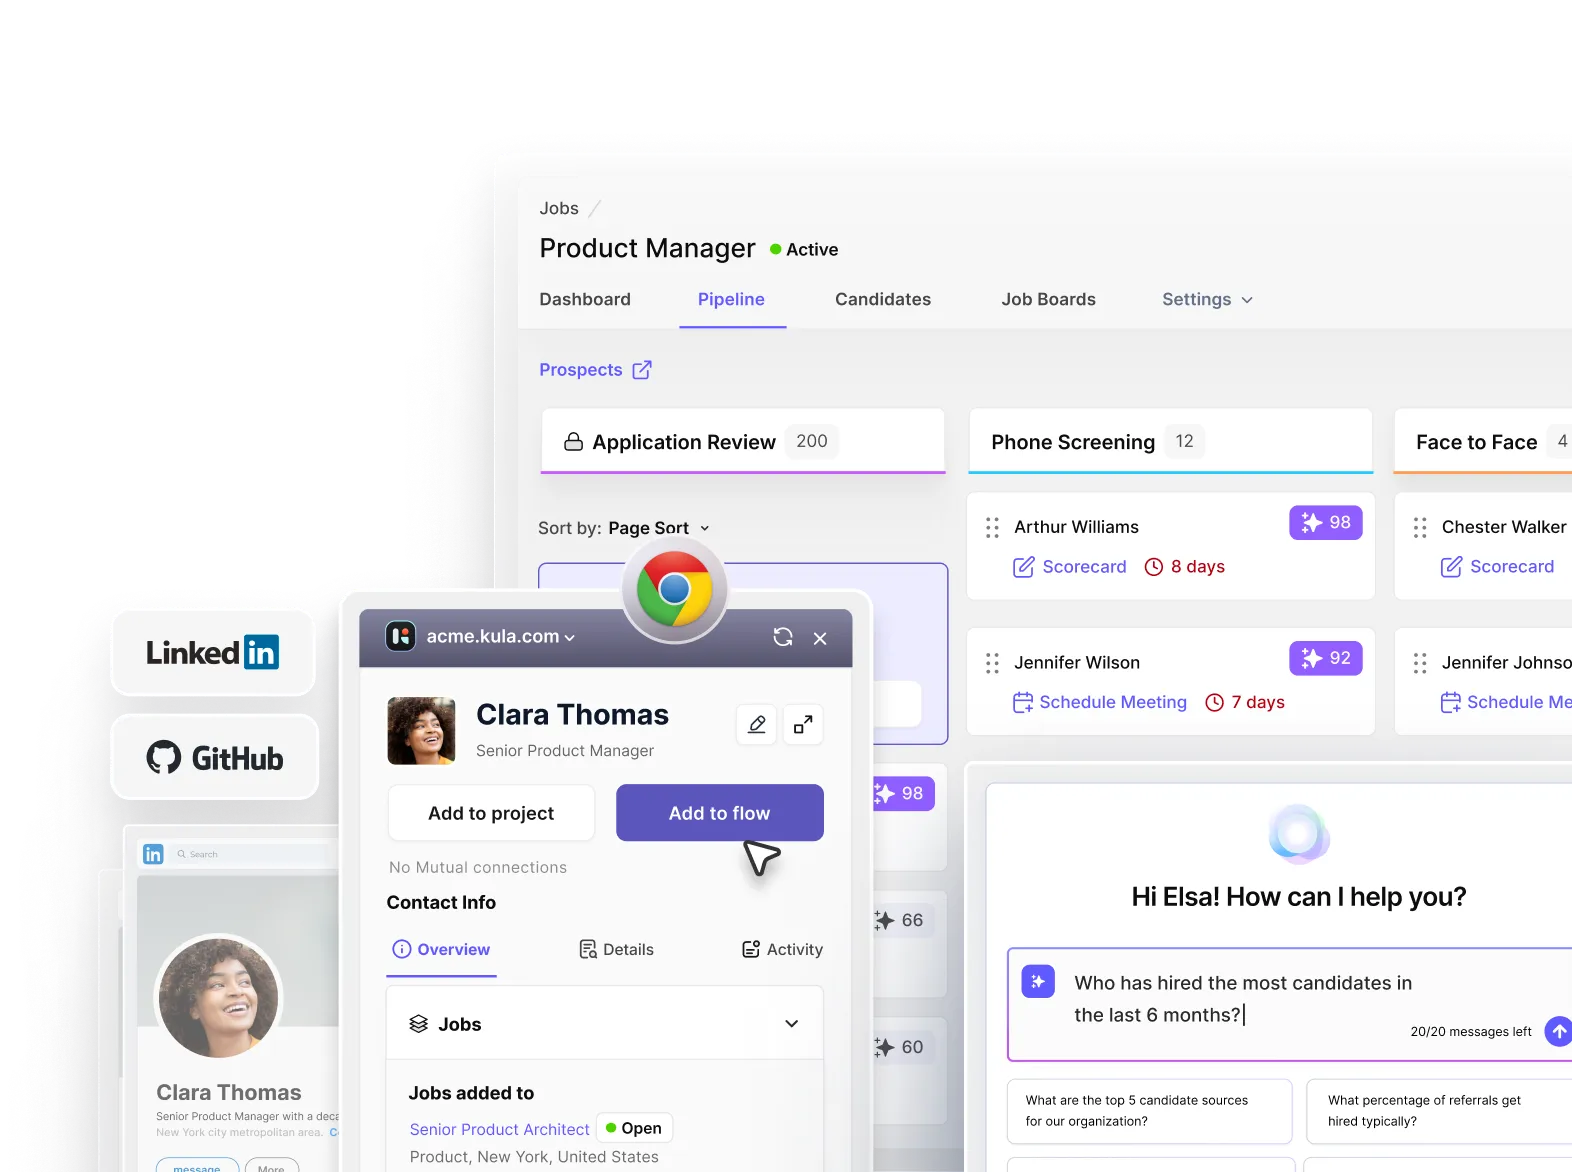





Learn how to build better ATS reporting with the right recruiting metrics, executive dashboards, pipeline analytics, quality-of-hire tracking, and real-time insights.
Many applicant tracking systems were built primarily to store candidate and hiring data, not to help recruiting teams analyze it.
That gap between having numbers and having answers is where most recruiting analytics fall short.
Getting a simple answer can mean exporting multiple reports, combining spreadsheets, and manually working through the numbers. Recruiters lose time building reports and executives lose confidence when two reports show different numbers.
Eventually hiring decisions end up relying on intuition because the data isn't easy to use.
The problem isn't a lack of recruiting data. Most teams have plenty of it. The problem is turning that data into answers you can act on.
We’re here to explain what effective ATS reporting and analytics should actually do, the key recruiting metrics worth tracking, and what modern recruiting analytics should look like.
Why ATS reporting fails for most hiring teams
Before adding another metric to your recruiting dashboard, look at how your team gets its existing numbers.
If answering a basic question about your hiring pipeline requires multiple reports, spreadsheets, and manual analysis, the problem isn't that your team needs more data. The problem is that the data isn't working hard enough for them.
That problem is widespread. Our 2025 State of Recruiting Report (which surveyed nearly 250 recruiting leaders) found that limited analytics and reporting capabilities are a challenge for 48% of hiring teams, making it harder to get real-time insights and use data to improve recruiting strategies.
Here are the five problems that tend to sit underneath it:
Failure 1: Excel is doing the actual work
One of the clearest signs of weak ATS reporting is when Excel becomes the real analytics engine.
A recruiter might export one report for candidate sources, another for hires, and another for time to fill. Someone then combines the data, cleans it up, adds formulas, and builds the view leadership needs.
That creates three problems quickly:
- Reports take hours instead of minutes
- Different people can calculate the same metric differently
- Reporting becomes dependent on whoever knows the spreadsheet workflow
The process gets even harder when recruiters are already juggling separate tools for sourcing, scheduling, analytics, and reporting. When those systems don't share data cleanly, recruiters spend their time moving between platforms instead of analyzing what the data means.
And that doesn't scale.
A manual reporting process might work for one recruiter managing a handful of roles. It becomes much harder to maintain when multiple recruiters, hiring managers, and business leaders need consistent recruiting metrics.
Failure 2: The numbers don't reconcile
Even when teams have the right data, they need to be able to trust it.
Say your recruiting dashboard shows 42 open roles, while a report from another system shows 47. Or your finance team has one number for time to fill and your recruiting team has another.
Someone now has to figure out why.
That means spending time checking filters, date ranges, definitions, exports, and formulas instead of answering the question that prompted the report in the first place.
And once executives start questioning the numbers, recruiting analytics loses its value. A report that requires a 15-minute explanation before anyone trusts it isn't doing enough.
The bigger issue is what teams choose to measure in the first place.
According to SHRM's 2025 Benchmarking Reports, only 20% of organizations track quality of hire. Teams may have plenty of data about applications, interviews, and hires, yet still lack visibility into whether those hiring decisions produced the outcomes they wanted.
More data doesn't automatically mean better decisions. Better data has to measure the right outcomes.
Failure 3: Reporting is limited when questions get more complex
Basic reports can tell you how many candidates applied or how many jobs were filled.
Recruiting leaders need to ask harder questions.
Which source produces the most qualified candidates? Which department is driving an increase in time to fill? Where are candidates dropping out? Which stage is slowing down the hiring process? Are certain roles consistently taking longer than others?
Answering those questions requires more than a static dashboard.
This is one reason why 34% of recruiting teams are prioritizing their investment in analytics from the past year. The same report shows that 52% of teams are focusing on data analytics and reporting, alongside 60% prioritizing advanced recruiting techniques.
The shift makes sense as hiring teams are being asked to make more data-informed decisions, but they can't do that if their reporting tools only show surface-level activity.
Failure 4: The visualization doesn't help you see the problem
Rows and columns can contain accurate information without making that information useful.
If you're trying to understand where candidates are dropping out, a funnel gives you a much faster answer than a spreadsheet. If you want to see whether time to fill is improving, a trend over time is more useful than a single average. If one department is affecting your overall hiring performance, you need to be able to break the data down by department.
Traditional recruiting software often rely on clunky dashboards that show individual numbers without helping teams connect them.
That leaves recruiting leaders with an uncomfortable problem: you can't fix what you can't measure, and you can't act on what you can't understand.
Good ATS analytics should make those patterns easier to see, not make recruiters work harder to find them.
Failure 5: Reporting creates more work instead of removing it
This is where all the other problems compound.
Recruiters already spend time switching between sourcing platforms, scheduling tools, spreadsheets, reporting systems, and their ATS. When those systems don't talk to each other, every new report can mean another export, another spreadsheet, and another manual reconciliation.
Eventually, the reporting process becomes a chore.
And when reporting takes more effort than the insight is worth, people stop using it. Recruiters fall back on activity-based metrics and personal judgment. Hiring managers rely on anecdotes from the latest roles they've worked on. Leaders get periodic snapshots instead of real-time visibility.
That creates a cycle:
Weak reporting → limited visibility → weaker decisions → poor hiring outcomes → less confidence in recruiting data.
The industry is already responding. Teams are investing more in advanced recruiting techniques, analytics, and reporting because they need better ways to make hiring decisions.
The next step isn't tracking every possible recruiting KPI.
It's building an ATS reporting and analytics system that connects the data, surfaces the right metrics in real time, and helps recruiting leaders understand what needs attention before a small problem becomes a hiring bottleneck.
The four categories of metrics every recruiting team should track
A recruiting dashboard can contain dozens of numbers and still tell you very little about your recruitment goals and its progress.
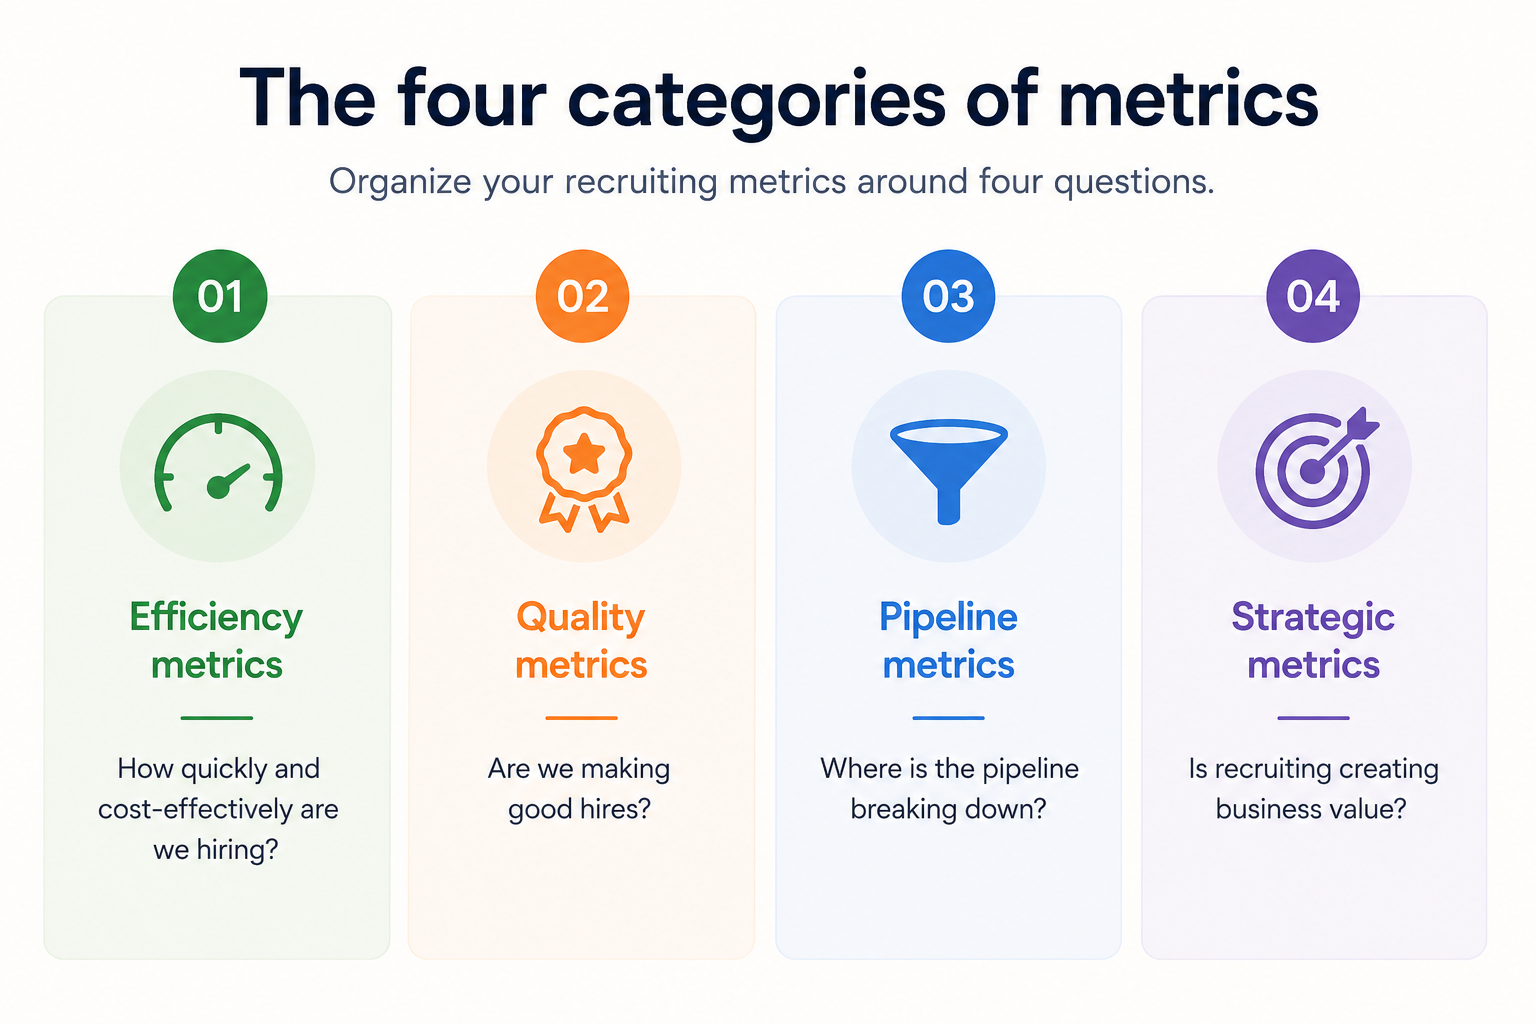
A better approach is to organize your recruiting metrics around four questions: How efficiently are we hiring? Are we making good hires? Where is the pipeline breaking down? And is recruiting creating business value?
Category 1: Efficiency metrics
These measure how quickly and cost-effectively your team moves from an open role to a hire.
Time to fill measures the days between opening a role and accepting an offer. It gives you a view of overall hiring speed, but the average can hide important differences between departments, seniority levels, and role types. Track it by these dimensions rather than relying on one company-wide number.
The latest Employ 2026 Recruiting Benchmarks Report found that median time to fill fell from 67.7 days in 2025 to 63.5 days in 2026 among the companies it tracked.
Time to hire starts later: it measures the time from a candidate's first contact to offer acceptance. Looking at both metrics helps separate delays in opening and approving roles from delays in actually moving candidates through the process.
Then there is cost per hire, which looks at recruiting spend relative to the number of hires. Don't evaluate it in isolation. A cheap hire who leaves after six months may be far more expensive than a higher-cost hire who stays and performs for two years.
Sourcing channel ROI takes this one step further by showing which channels generate hires relative to their cost. And interview-to-hire ratio tells you how much interview activity is required to produce one hire, helping identify inefficient candidate screening or interview processes.
Category 2: Quality metrics
Speed matters, but getting the right person through the door matters more.
That shift is reflected in current recruiting priorities.
We found that quality of hire is ranked as the most critical KPI by 62% of recruiting leaders, although defining and measuring it consistently remains difficult. Enhancing quality of hire was also a primary recruiting goal for 52% of hiring teams in 2025.
Quality of hire can combine factors such as job performance, ramp-up time, engagement, and retention. There isn't one universally accepted formula, so teams should define it around the outcomes that matter for their roles.
A practical starting point is 12-month retention combined with performance ratings.
Other useful quality metrics include first-year retention by source, offer acceptance rate, time to productivity, and hiring manager satisfaction. Together, they tell you whether candidates are not just moving through the funnel, but becoming successful employees.
Category 3: Pipeline metrics
Pipeline metrics show what is happening between application or sourcing and hire.
Track applications per role to understand the volume entering your funnel, then look at pass-through rates by stage to see how many candidates progress.
Time in each stage also adds another layer.
For example, if candidates are sitting too long at recruiter review, your targeting or screening process may need attention. If they are waiting days for interview feedback, the bottleneck may be capacity rather than candidate quality.
For sourcing teams, sourced-to-hire conversion rate shows how effectively sourced candidates turn into hires.
Rediscovery rate is another useful metric for teams with a large existing talent database.
Instead of measuring how many new candidates recruiters can find, it measures how often they successfully find candidates already in the ATS. That can reveal whether your team is getting enough value from its existing candidate pool before spending more time and money on new candidate sourcing strategies.
Category 4: Strategic metrics
The final category connects recruiting performance to broader business outcomes.
Diversity representation by funnel stage can show whether representation changes as candidates move from application through interview and hire. Looking at the full funnel is more useful than measuring diversity only at the hiring stage because it can help identify where representation is changing.
Candidate experience metrics, including candidate NPS or post-process satisfaction, show how candidates perceive the hiring process, including those who aren't hired.
Recruiter productivity can include hires per recruiter over a defined period, but it should always be interpreted alongside quality and complexity. A recruiter filling seven junior roles isn't necessarily more productive than one filling three highly specialized positions.
Finally, business impact metrics such as cost of vacancy, revenue per hire, and retention-adjusted quality of hire connect recruiting outcomes to what business leaders care about.
The point isn't to track all of these metrics.
It's to build an ATS reporting and analytics framework where each category answers a different question. Efficiency tells you how the process performs. Quality tells you whether the outcome is good. Pipeline shows where the process is working or breaking. Strategic metrics show whether recruiting is contributing to the business.
And notably, while 49% of recruiters still want to reduce time to hire, speed is taking a backseat to making sure the right talent comes through the door. That is exactly why recruiting teams need to look beyond time-based ATS metrics and measure what happens after the hire.
What executives need to know from ATS recruiting data
Your CEO probably doesn't want to see every recruiting KPI in your applicant tracking system. They want answers to a handful of business questions: Are we hiring fast enough? Are we hiring the right people? What is hiring costing us? And where is the process getting in the way?
Your ATS reporting and analytics should make those answers easy to find. Here’s what your reporting dashboard should be able to answer for your right off the bat:
“How fast are we hiring?”
Start with the time-to-fill trend by month, rather than a single company-wide average. Pair it with time to hire for sourced candidates and interview-to-offer velocity to understand whether changes in hiring speed are coming from sourcing, interviews, or later stages of the process.
Executives generally care more about the direction than one absolute number. If time to fill has moved from 65 to 52 days over three quarters, that's more useful than knowing the current average is 52 days.
“Are we hiring the right people?”
This is where quality of hire becomes more important than speed.
Track your quality-of-hire trend alongside 12-month retention by source, hiring manager satisfaction, and performance ratings at six and 12 months. Looking at these metrics together can reveal whether faster hiring is actually producing better outcomes or simply moving candidates through the funnel more quickly.
“How much is this costing us?”
Cost per hire is the obvious starting point, but leadership usually needs more context.
Track its trend over time, recruiting spend as a percentage of headcount, sourcing channel ROI, and the cost of vacancies by role type. A role that stays open for three months can have a very different business cost from one that stays open for three weeks, even if the recruiting spend looks similar.
“Where are we losing candidates?”
Your recruiting analytics dashboard should make pipeline drop-off visible.
Look at pass-through rates by stage, time in stage by department, offer acceptance rate trends, and candidate experience metrics such as candidate NPS by rejection stage. A sudden drop between interview and offer tells you something very different from a drop between application and recruiter screen.
“Are we hiring diverse teams?”
Company-wide representation can hide what is happening inside the funnel.
Track representation at each stage by relevant demographic dimension. If representation is strong at the application stage but falls sharply during interviews, the overall hiring percentage won't tell you where the problem is.
Stage-level ATS metrics give recruiting leaders a much more actionable view of where representation changes.
“Is recruiting scaling?”
Finally, leadership needs to know whether the recruiting function can support business growth without simply adding recruiters every time hiring volume increases.
Track hires per recruiter per quarter, applications per role over time, and recruiter productivity alongside hiring volume. These metrics can show whether the team is becoming more efficient or whether growth is requiring roughly linear headcount increases.
Match the reporting rhythm to the metric
Not every metric needs to appear in every meeting.
Weekly reports should focus on pipeline movement and immediate hiring outcomes. Monthly reporting is better suited to efficiency trends such as time to fill, time to hire, and sourcing performance. Quarterly reporting can focus on quality of hire, retention, diverse sourcing, and broader business impact.
Trying to review everything every week creates noise instead of insight.
The executive dashboard itself should stay simple:
- Four to six key metrics
- Their direction of travel
- A short explanation of what changed and why
The goal of executive recruiting reporting isn't to prove that the recruiting team has data. It's to give leadership enough reliable context to decide where to invest, what to change, and where the hiring process needs attention.
What modern ATS analytics and reporting dashboards should deliver
The best ATS tool should let recruiters answer questions, investigate problems, and build reports without exporting data into spreadsheets or relying on someone with technical expertise to pull the numbers.
Here are the key ATS features you should look for if you’re prioritizing reporting and analytics:
1. Native custom dashboards
Custom dashboards should be part of the ATS itself, not something that requires a separate BI tool or a spreadsheet workaround.
Recruiters and talent leaders should be able to choose the recruiting metrics they want to track, combine them into a dashboard, and adjust filters or views as their reporting needs change.
The difference is especially noticeable when someone asks a new question. Instead of submitting a request for a custom report, the person closest to the hiring process can build the view themselves.
Ashby, for example, offers self-serve report building, customizable dashboards, filters, segmentation, and drill-downs across recruiting data.
2. Real-time conversational analytics
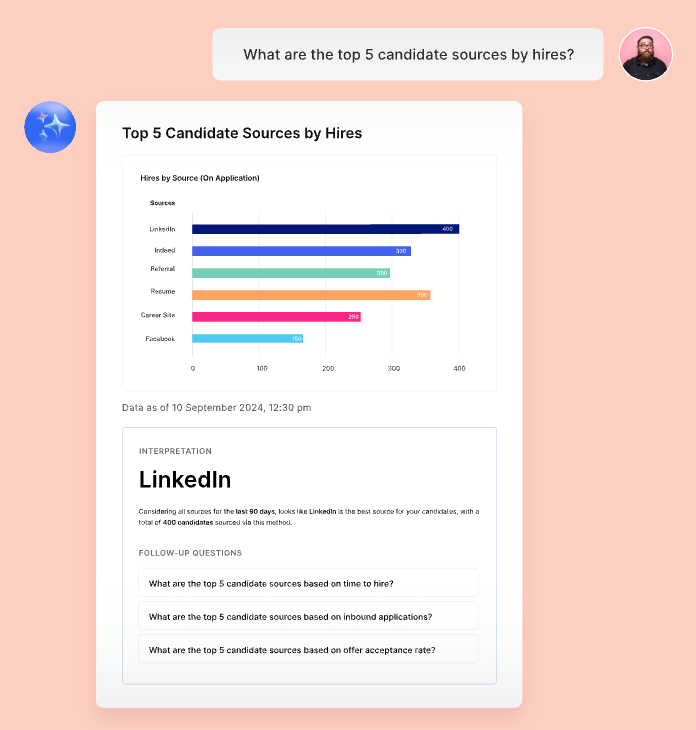
This is one of the newer developments in ATS reporting: being able to ask the system a question in plain English and get the answer without building a report first.
A recruiter might ask, “Which departments are behind their hiring targets?” or “How many candidates are currently in hiring manager review?” and receive the relevant data, visualization, or follow-up insight.
Kula's Conversational Analytics works this way.
Recruiters can ask questions about hiring data, including pipeline, time to hire, offer acceptance, and source performance, and get the results through charts or tables. They can then continue the conversation to dig further into the data.
Gem is approaching the same problem with its AI Copilot for Recruiting, designed to make recruiting data more accessible to people who don't want to build reports or work directly with datasets.
The idea is that you should be able to ask the question first and figure out the report second, rather than the other way around.
3. Multi-source integration
Recruiting data rarely lives entirely inside the ATS.
Sourcing activity, candidate communication, scheduling, HRIS data, and recruiting performance can sit across different systems. When those systems don't connect, recruiters become the integration layer, exporting information and reconciling it manually.
Modern recruiting analytics should pull relevant information together automatically.
Gem, for example, connects sourcing and recruiting activity with ATS data to provide a fuller view of the funnel, including activity that typically happens before a candidate enters the ATS.
The point isn't to eliminate every tool in your recruiting stack. It's to make sure your reporting doesn't depend on manually moving data between them.
4. Disaggregated analytics
If time to fill increased from 55 to 63 days, the next question is obvious: where did that increase come from?
Modern ATS analytics should let you break the number down by department, role type, seniority, recruiter, source, location, or time period without requiring custom development or a new spreadsheet.
The same applies to funnel and diversity reporting. Looking only at overall representation can hide where candidates are dropping out. Stage-level data can show whether the change happens during sourcing, screening, interviews, or offers.
Ashby's reporting, for instance, allows teams to filter and segment recruiting data across fields and drill into individual data points.
5. Predictive analytics
Most ATS reporting tells you what already happened. Predictive analytics uses historical and current data to estimate what might happen next, such as whether a role is likely to miss its hiring target.
For recruiting teams, that could mean using current pipeline volume and historical conversion rates to forecast whether a role is likely to hit its hiring target or how much additional pipeline may be needed.
IBM showed the potential of this approach with its predictive attrition software that could identify employees likely to leave within six months with 95% accuracy.
Gem, for example, also offers forecasting based on historical hiring data and current headcount targets.
That makes reporting more useful for planning. Instead of discovering at the end of the quarter that a team is behind target, recruiters can spot the risk earlier and adjust their sourcing or hiring strategy.
6. Native pipeline funnels
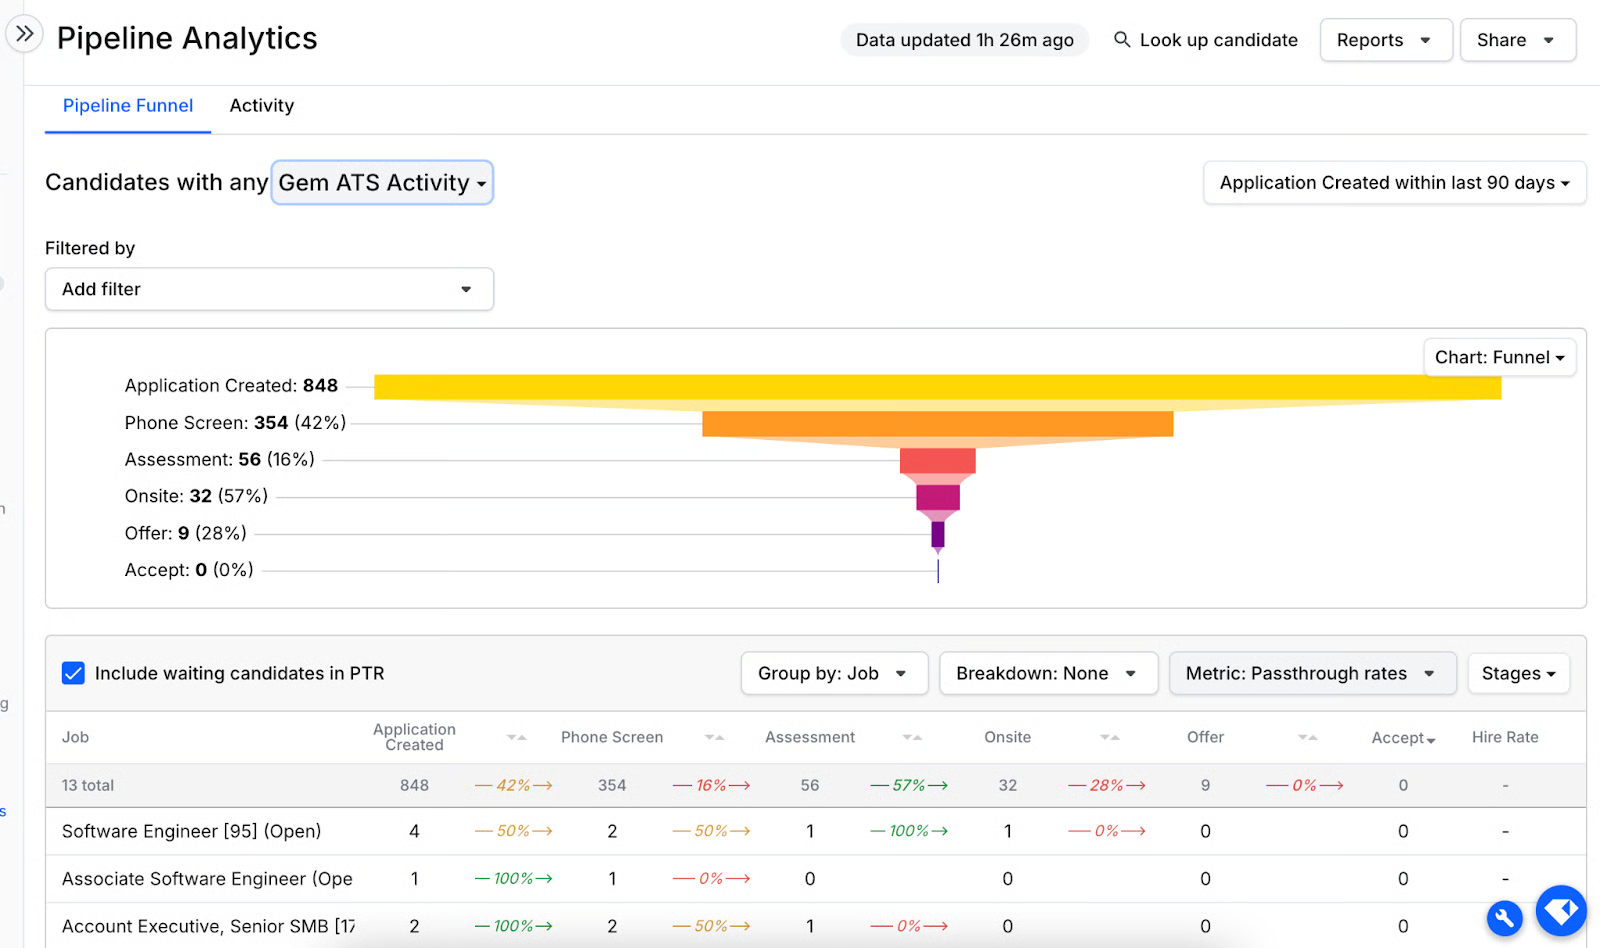
A funnel shouldn't just tell you how many candidates are sitting at each stage.
The useful version lets recruiters investigate the numbers behind it.
If 150 candidates enter a pipeline but only 20 reach interviews, you should be able to see where the biggest drop-off occurs and drill into the candidates contributing to it. If one department has a much lower pass-through rate than another, you should be able to investigate that difference without exporting the entire pipeline.
7. AI-assisted insight generation
Conversational analytics answers a question when you ask it. AI-assisted insight generation goes one step further by helping surface something you may not have noticed.
For example, instead of simply showing that time to fill increased this quarter, an analytics system could flag the change and point out that most of the increase came from a particular department or hiring stage.
That's a meaningful difference between “here's the data” and “here's what changed.”
Kula's analytics experience combines conversational questions with dashboards, reports, filters, and real-time hiring insights. Ashby takes a more self-serve BI-style approach, while Gem combines funnel analytics, forecasting, and AI capabilities across its recruiting platform.
The approaches are different, but they're moving toward the same outcome: recruiters should spend less time preparing the data and more time deciding what to do with it.
How to implement recruiting analytics that leadership actually uses
1. Start with questions, not dashboards
Don't build a dashboard first and then search for something interesting in the data.
Start by asking leadership what they actually need to know. Are hiring targets on track? Which roles are taking too long? Which sourcing channels produce the best hires? Build the recruiting reports around those questions.
2. Define every metric
Every recruiting metric needs a definition that everyone agrees on.
Take time to fill. Does it start when headcount is approved, when the requisition opens, or when the job is posted? Does it end when an offer is accepted or when the candidate starts?
Document the definition and use it consistently across dashboards. Otherwise, two teams can report different numbers and both believe they're right.
3. Reconcile before publishing
If the recruiter dashboard says 42 days and the CEO's dashboard says 38, the conversation quickly stops being about hiring performance and starts being about whose data is correct.
Reconcile numbers across reports before they reach leadership. Consistent definitions, data sources, and calculations are essential for building trust in ATS reporting.
4. Show trends, not isolated numbers
A time-to-fill figure means very little on its own.
Showing that it fell from 55 to 45 days over the past two quarters tells leadership much more. Add relevant benchmarks or comparisons where available, and the number becomes easier to interpret and act on.
5. Get attribution right
A candidate may interact with several recruiting channels before becoming a hire. Giving all the credit to the source that submitted the final application can hide which channels actually created demand.
Where your ATS supports it, use first-touch and multi-touch attribution alongside last-touch attribution. This gives you a better picture of which channels are generating candidates and how different touchpoints contribute to the eventual hire.
6. Automate recurring reporting
Weekly and monthly recruiting reports shouldn't require someone to rebuild the same spreadsheet every time.
Automate recurring reports wherever possible. Reserve manual analysis for quarterly reviews, unusual questions, and decisions that actually require human judgment.
7. Teach your team how to use the data
A dashboard is only useful if the people looking at it know what they're looking at.
Hiring managers and executives should understand what metrics such as pass-through rate, time in stage, and offer acceptance rate actually indicate. Otherwise, a dashboard can create more questions than answers.
8. Keep improving the dashboards
Your first dashboard won't be perfect. That's fine.
Review it with the people using it, see which metrics they actually rely on, remove what they consistently ignore, and add what they're repeatedly asking for. The goal isn't to build the biggest recruiting analytics dashboard. It's to build one that helps leadership make better hiring decisions.
Are your recruiting reports helping you make decisions?
Good ATS reporting isn't about having the most metrics or the prettiest dashboard. It's about being able to move from a hiring question to a useful answer quickly.
A simple way to test whether your analytics are doing that:
- Can you produce a one-page executive report in under 30 minutes without opening Excel? If not, too much of the reporting process is still manual.
- When leadership asks why a number changed, can you investigate it inside the ATS in under two minutes? If answering a follow-up requires another export or spreadsheet, your reporting is still too static.
- Do hiring managers actually use the dashboards without being asked? If they don't, the reporting may be technically available but isn't solving a real decision-making problem.
If producing a report still means exporting data, fixing spreadsheets, or asking someone to build a custom view, your ATS is creating more reporting work than it should.
The real test is simple: can your team get a reliable answer when a hiring question comes up?
If leadership asks why time to fill increased, which source is producing the best hires, or where candidates are dropping out, the answer shouldn't take hours to find.
That’s the standard modern recruiting teams should expect from their ATS analytics.
Kula brings conversational analytics, native dashboards, and multi-source recruiting data into the ATS, giving recruiting teams a faster way to get answers without piecing reports together manually.
Try Kula today if you want to spend less time finding numbers, and more time using them.

An ATS should provide customizable dashboards, real-time reporting, pipeline and funnel analytics, filters and drill-downs, and the ability to track metrics such as time to fill, time to hire, source performance, offer acceptance, and quality of hire. More advanced systems may also offer conversational analytics, predictive insights, and integrations with other recruiting and HR systems.
Some popular ATS reporting tools include Kula, Ashby, and Gem. Kula offers pre-built and custom dashboards, real-time reporting, and conversational analytics that lets recruiters ask questions about hiring data and get answers without manually building reports. Ashby offers BI-level analytics with drag-and-drop customization, while Gem combines recruiting analytics with its AI Copilot for Recruiting.
Start by defining the question the report needs to answer, then select the relevant recruiting metrics and filters. Segment the data by factors such as department, role, seniority, source, or time period, and choose the visualization that makes the trend easiest to understand. Ideally, your ATS should let you build and save these reports directly rather than requiring data exports to Excel.
ATS analytics can show where hiring slows down, which sourcing channels perform best, and where candidates drop out of the funnel. Tracking metrics such as time to fill, time in stage, pass-through rates, and sourced-to-hire conversion helps recruiting teams identify bottlenecks and focus their efforts where they can have the biggest impact.
An ATS diversity and inclusion report should track representation at each stage of the hiring funnel, not just among final hires. Useful metrics include demographic representation across applicants, sourced candidates, screens, interviews, offers, and hires, along with pass-through rates and drop-off by demographic group. This helps identify where representation changes during the recruiting process and where further investigation may be needed.